Introduction
On many days in Hong Kong, weather changes can be felt within hours: a humid southwest flow replaced by a dry northeast wind, a clear morning sky turning into heavy showers by afternoon, or a distant tropical cyclone rapidly intensifying as it approaches the South China Sea. These changes are not random; they result from organised weather systems interacting with Hong Kong’s position on the southern China coast. This chapter introduces the main systems that affect Hong Kong—the summer and winter monsoons, tropical cyclones, and associated fronts and troughs—and then shows how surface charts, upper‑air analyses, satellite imagery, and Doppler radar are used together for real‑time monitoring and short‑range forecasting.
Seasonal Monsoon Systems over Hong Kong
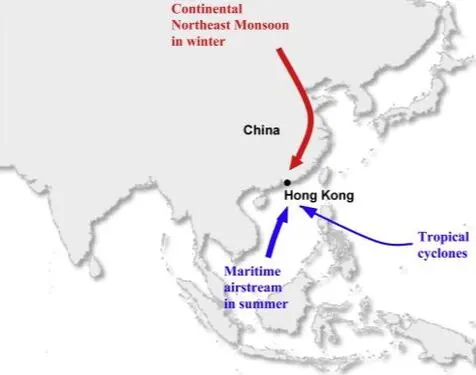
Hong Kong lies in the subtropics on the southern coast of China and is influenced by both the East Asian monsoon circulation and weather systems embedded in the mid‑latitude westerlies.
|
Summer Monsoon (May–September)
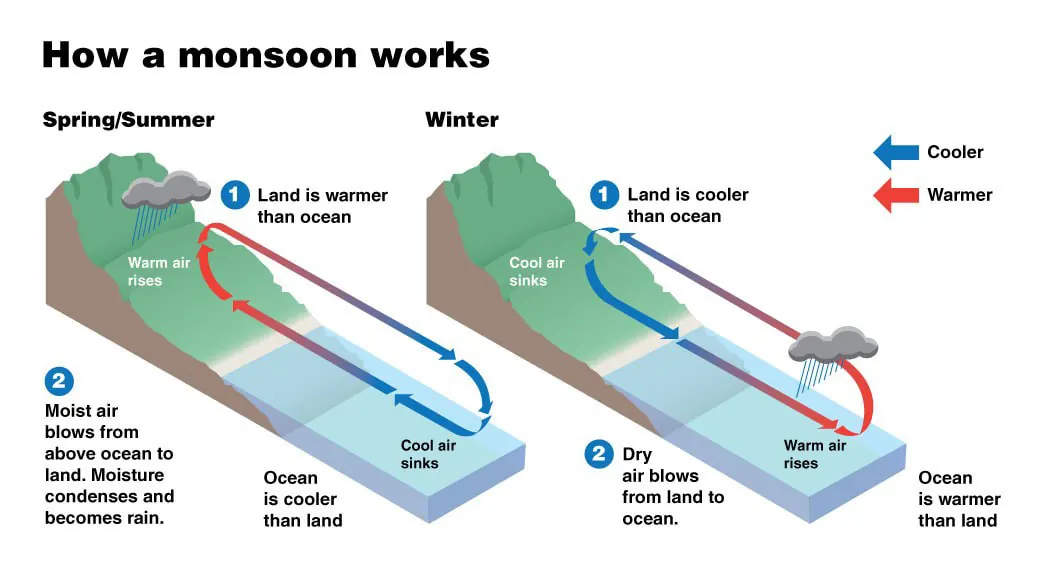
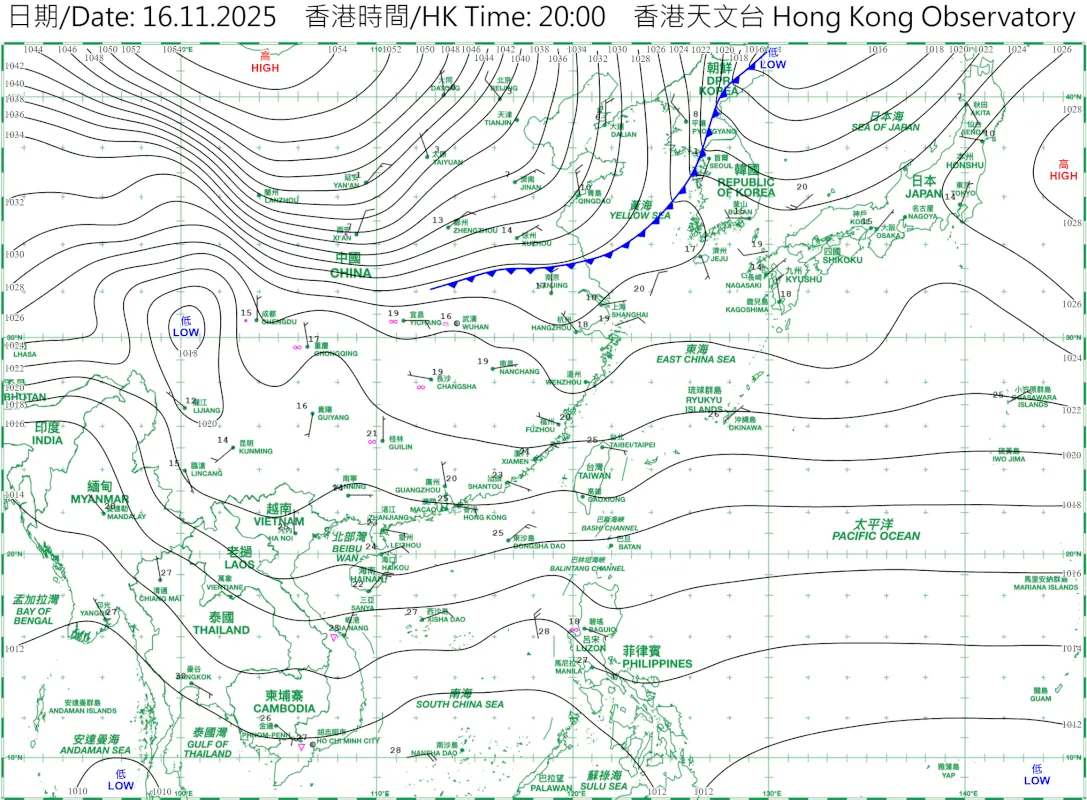
In summer, lower pressure over the heated Asian continent and higher pressure over surrounding oceans drive south to southwesterly monsoon winds across the South China Sea toward South China. Over Hong Kong this brings warm, moist air, frequent showers and thunderstorms, and provides the background flow in which many tropical disturbances and cyclones develop. About 80% of annual rainfall occurs during this period. Winter (Northeast) Monsoon (October–April) In winter, a strong high forms over the cold Asian interior and pressure is lower over the western Pacific, so air flows from land to sea. After being turned by Coriolis force and friction, Hong Kong experiences mainly northerly to northeasterly winds, cooler and drier conditions. During cold surges, rapid temperature drops and stronger winds visible as closely spaced isobars between the continent and the South China Sea. |
  |
Tropical Cyclone Formation and Structure
Formation Environment
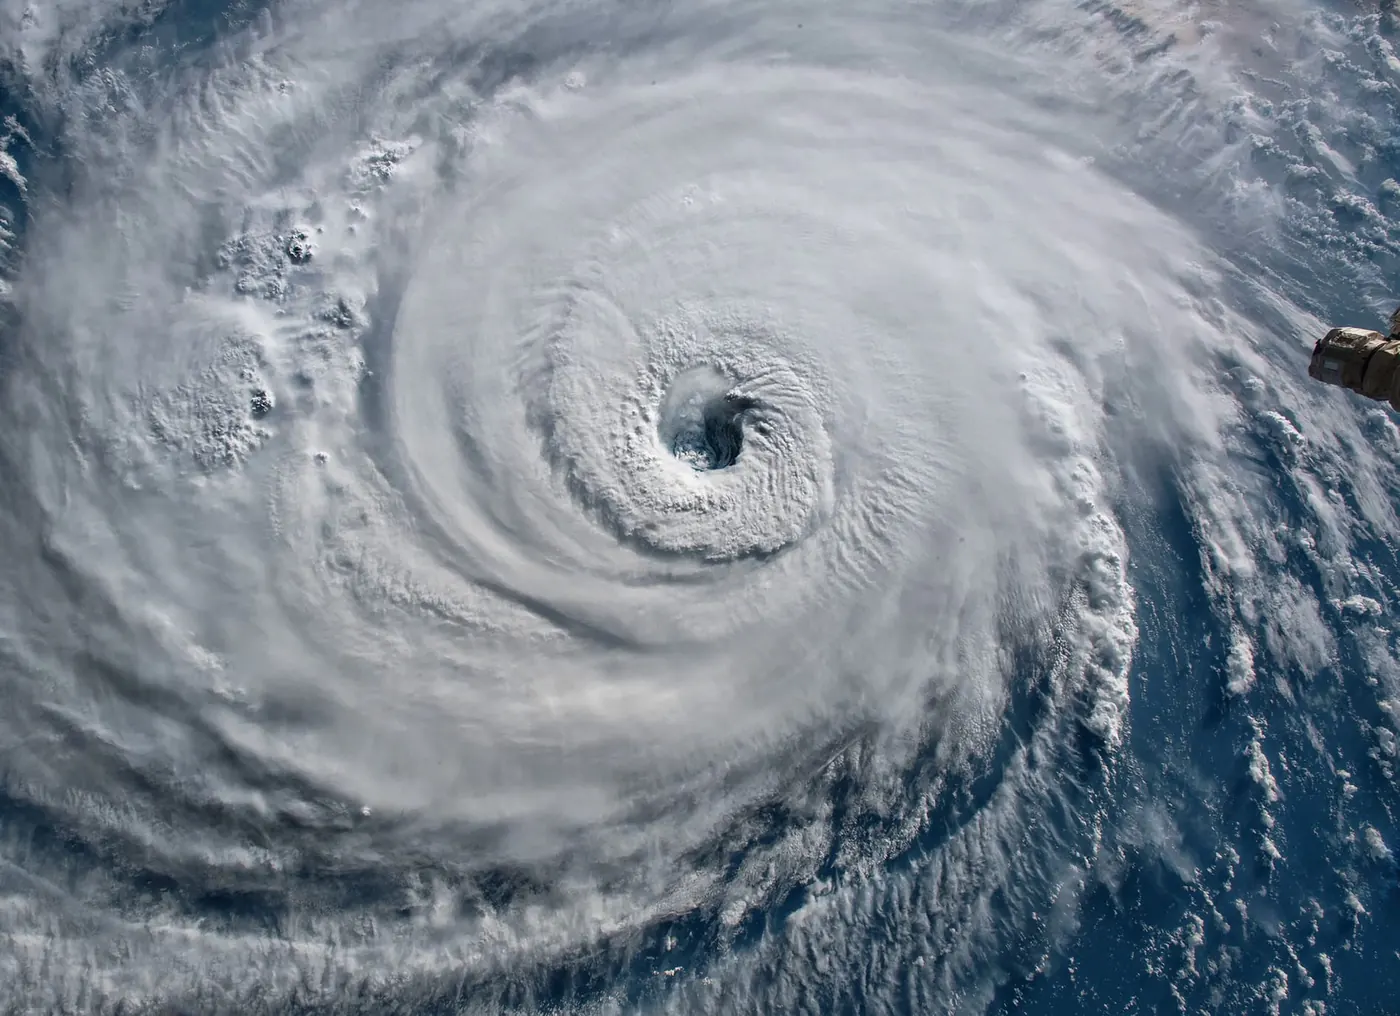
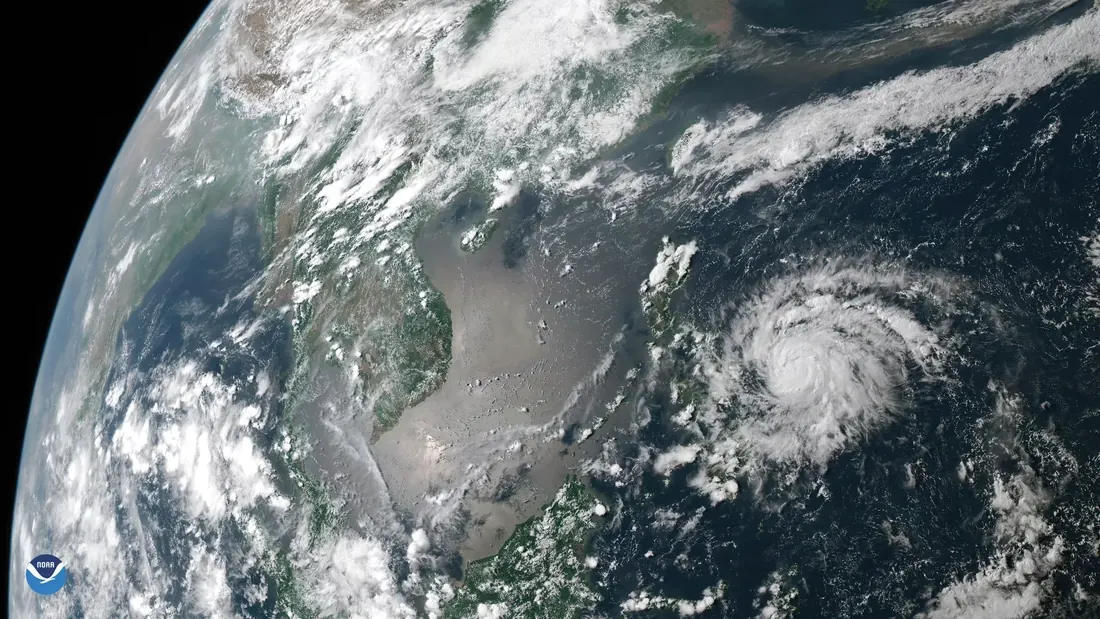
Air near the equator moves eastward with Earth’s rotation; air closer to the equator has a larger distance from Earth’s axis and therefore a higher tangential speed than air at higher latitudes. When air flows toward a low‑pressure region away from the equator, the pressure‑gradient force pulls it inward but the Coriolis force deflects it, so the flow curves and begins to rotate around the centre. As the air spirals inward and its radius of rotation decreases, conservation of angular momentum increases its tangential speed, strengthening the cyclonic vortex around the low in the Northern Hemisphere.
Typical central sea‑level pressures in western North Pacific storms are around 980–995 hPa for weaker tropical storms, 960–980 hPa for severe tropical storms or minimal typhoons, and below 950 hPa for stronger typhoons, compared with ambient pressures near 1010–1015 hPa. The pressure deficit (ambient minus central pressure) is linked to maximum sustained wind speed: larger deficits correspond to stronger winds, and rapid intensification is associated with central pressure falls on the order of tens of hPa per day.
Air near the equator moves eastward with Earth’s rotation; air closer to the equator has a larger distance from Earth’s axis and therefore a higher tangential speed than air at higher latitudes. When air flows toward a low‑pressure region away from the equator, the pressure‑gradient force pulls it inward but the Coriolis force deflects it, so the flow curves and begins to rotate around the centre. As the air spirals inward and its radius of rotation decreases, conservation of angular momentum increases its tangential speed, strengthening the cyclonic vortex around the low in the Northern Hemisphere.
Typical central sea‑level pressures in western North Pacific storms are around 980–995 hPa for weaker tropical storms, 960–980 hPa for severe tropical storms or minimal typhoons, and below 950 hPa for stronger typhoons, compared with ambient pressures near 1010–1015 hPa. The pressure deficit (ambient minus central pressure) is linked to maximum sustained wind speed: larger deficits correspond to stronger winds, and rapid intensification is associated with central pressure falls on the order of tens of hPa per day.
Vertical Structure
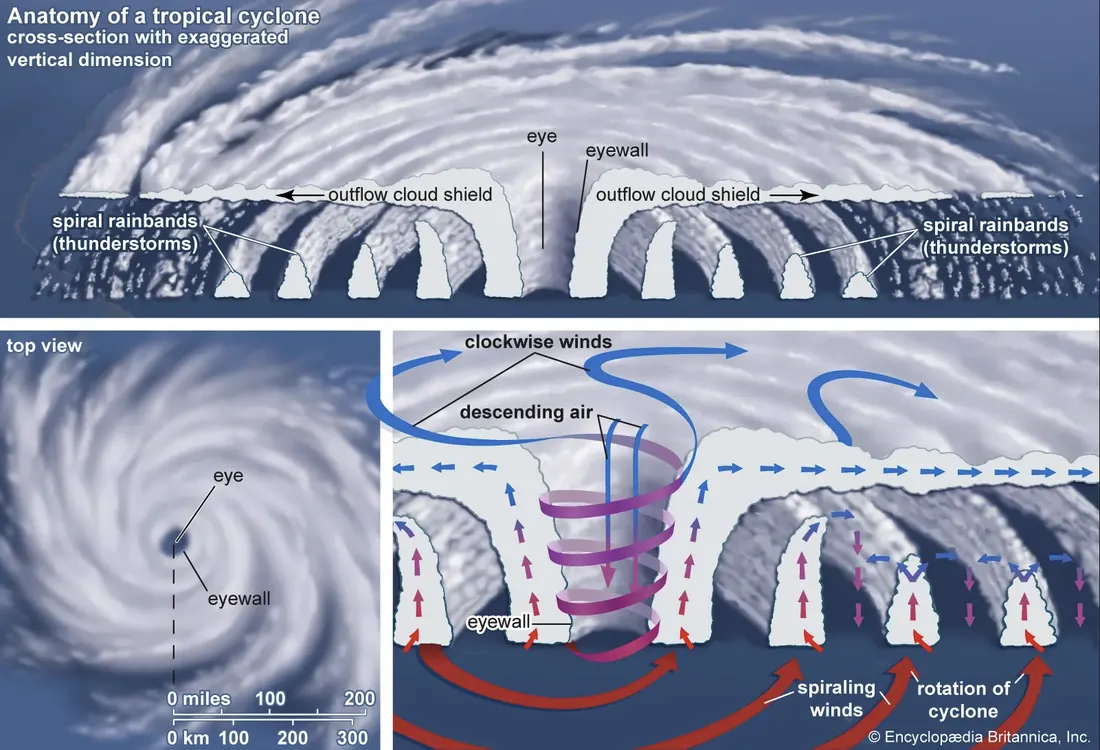
Vertically, tropical cyclones have a warm core: temperatures in the eye and eyewall are higher than the environment at the same pressure levels, especially in the mid‑ to upper troposphere. Near the surface, air spirals inward in the boundary layer and rises in the eyewall, while air subsides slowly in the eye and spreads outward as upper‑level outflow. Spiral rainbands extend outward with alternating convective and stratiform regions, but the strongest updrafts and heaviest rain are usually within the eyewall, which can reach altitudes of roughly 14–16 km.
Vertically, tropical cyclones have a warm core: temperatures in the eye and eyewall are higher than the environment at the same pressure levels, especially in the mid‑ to upper troposphere. Near the surface, air spirals inward in the boundary layer and rises in the eyewall, while air subsides slowly in the eye and spreads outward as upper‑level outflow. Spiral rainbands extend outward with alternating convective and stratiform regions, but the strongest updrafts and heaviest rain are usually within the eyewall, which can reach altitudes of roughly 14–16 km.
Intensity
Maximum sustained surface wind speeds span from about 63–118 km h⁻¹ for tropical storms to ≥118 km h⁻¹ for typhoons, with strong typhoons exceeding roughly 178–209 km h⁻¹ and the most intense cases reaching or exceeding 250 km h⁻¹. The highest winds are normally found in the eyewall just above the surface within the boundary layer, decreasing toward the eye and into the outer rainbands and also decreasing with height above the low‑level wind maximum.
Maximum sustained surface wind speeds span from about 63–118 km h⁻¹ for tropical storms to ≥118 km h⁻¹ for typhoons, with strong typhoons exceeding roughly 178–209 km h⁻¹ and the most intense cases reaching or exceeding 250 km h⁻¹. The highest winds are normally found in the eyewall just above the surface within the boundary layer, decreasing toward the eye and into the outer rainbands and also decreasing with height above the low‑level wind maximum.
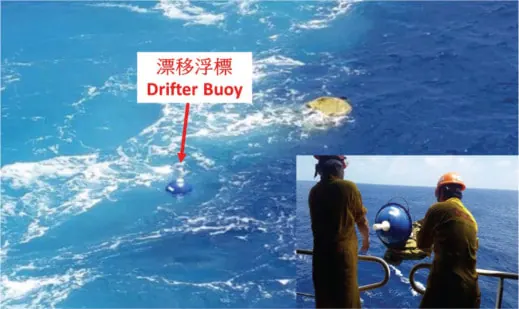 HKO deployed its first drifting buoy over the central part of the South China Sea in June 2015.
|
 At 00 UTC on 17 October 2016, one of the drifting buoys deployed by HKO, captured a pressure reading of 985.1 hPa near the eye of Typhoon Sarika (Progress in Hong Kong’s Tropical Cyclone Forecasting and Warning Services in Recent Decades
Author links open overlay panel
Wai-Kin Wong
,
Chun-Wing Choy)
|
HKO Surface Charts
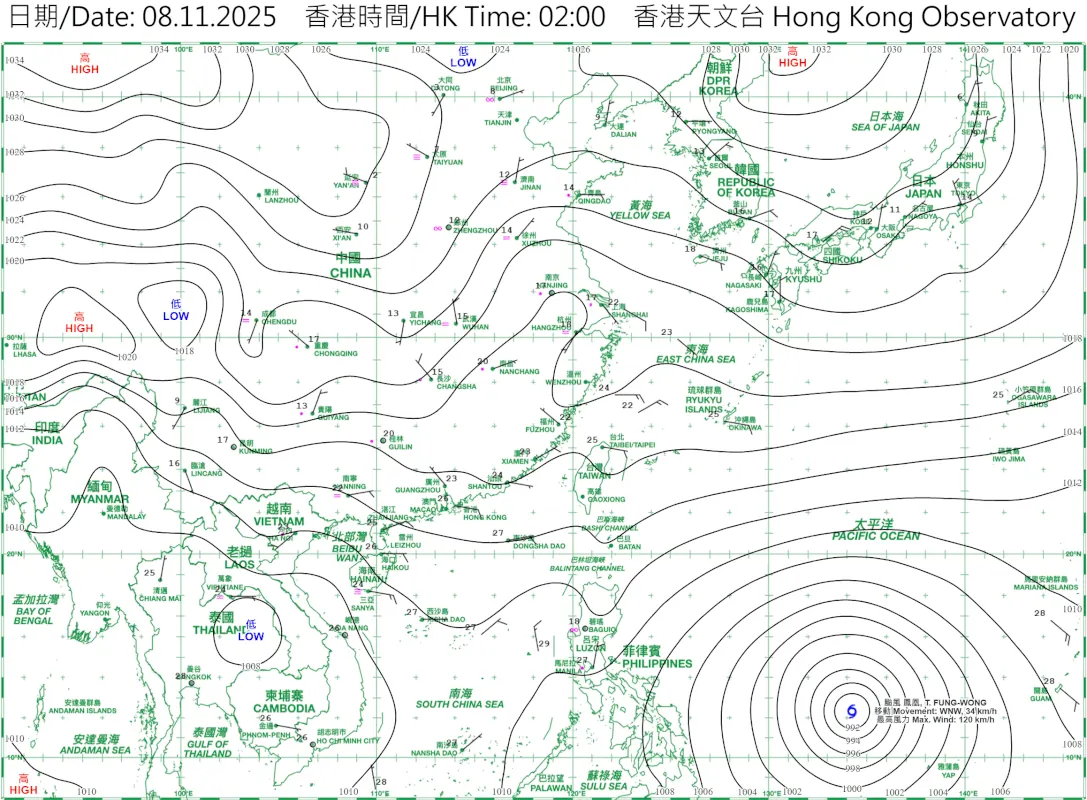
Hong Kong Observatory surface analysis charts display regional sea-level pressure patterns using isobars—lines connecting points of equal pressure, typically drawn every 2 or 4 hPa. The spacing between these isobars indicates the pressure gradient, which determines the expected near-surface wind strength.
Fronts, shown with standard symbols, mark boundaries between different air masses. A cold front's passage in South China is typically associated with a wind shift to northerly or northeasterly, a temperature drop, and changes in cloud and rainfall. Warm fronts and stationary fronts are less common in the region but can still bring layered cloud and rain. Finally, tropical cyclone centres are plotted with a specific symbol, labelled with the system's name and central pressure, allowing users to track their position and movement relative to Hong Kong.
- High-pressure areas, or anticyclones, are marked with an "H" and feature roughly circular isobars with pressure decreasing outward. In the Northern Hemisphere, winds circulate clockwise around a high. When a ridge from a continental high extends over the South China coast, Hong Kong often experiences more settled and drier weather.
- Conversely, low-pressure areas, or cyclones, are marked with an "L" with isobars increasing outward. Winds circulate anticlockwise around them, and these systems frequently bring cloudier and wetter conditions to Hong Kong when their centres or troughs are nearby.
- Other key features include ridges and troughs. A ridge is an elongated zone of higher pressure extending from a high, often bringing easterly or northeasterly winds to Hong Kong when positioned along the southeast China coast.
- A trough is an elongated region of lower pressure extending from a low; summer monsoon troughs over the South China Sea are particularly important zones for low-level convergence and storm development.
Fronts, shown with standard symbols, mark boundaries between different air masses. A cold front's passage in South China is typically associated with a wind shift to northerly or northeasterly, a temperature drop, and changes in cloud and rainfall. Warm fronts and stationary fronts are less common in the region but can still bring layered cloud and rain. Finally, tropical cyclone centres are plotted with a specific symbol, labelled with the system's name and central pressure, allowing users to track their position and movement relative to Hong Kong.
Satellite Imagery
Satellites passing over East Asia or stationed above provide visible, infrared, and water‑vapour imagery.
Summer monsoon conditions often appear as broad cloud areas and convective clusters along the monsoon trough, while winter surges show low cloud over the South China Sea and clearer skies behind cold fronts. Tropical cyclones show spiral bands, central dense overcast, and sometimes a clear eye with cirrus outflow aloft; loops of images allow students to track movement and note structural changes linked to intensification or weakening.
- Visible images show reflected sunlight and are useful by day for identifying cloud shapes, frontal bands, and cyclone eyes and bands;
- Infrared images show emitted thermal radiation and give cloud‑top temperature day and night, with colder tops indicating deeper convection.
- Water‑vapour images highlight mid‑ to upper‑tropospheric moisture patterns and help locate upper‑level troughs, ridges, and jet‑related features.
Summer monsoon conditions often appear as broad cloud areas and convective clusters along the monsoon trough, while winter surges show low cloud over the South China Sea and clearer skies behind cold fronts. Tropical cyclones show spiral bands, central dense overcast, and sometimes a clear eye with cirrus outflow aloft; loops of images allow students to track movement and note structural changes linked to intensification or weakening.
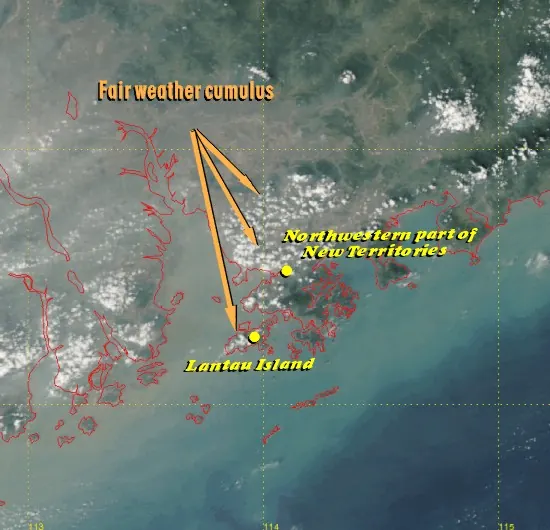 Fair-weather cumulus over coastal Guangdong on 28 October 2004. Taken at 1:14 p.m. local time by NASA’s EOS Aqua satellite and presented as a true‑colour composite (channels 1, 3, and 4), the image shows largely cloud‑free conditions over Hong Kong, with small “cotton ball” cumulus clouds over Lantau Island and northwest New Territories that are not associated with rainfall. Image adapted from the Hong Kong Observatory (www.hko.gov.hk).
|
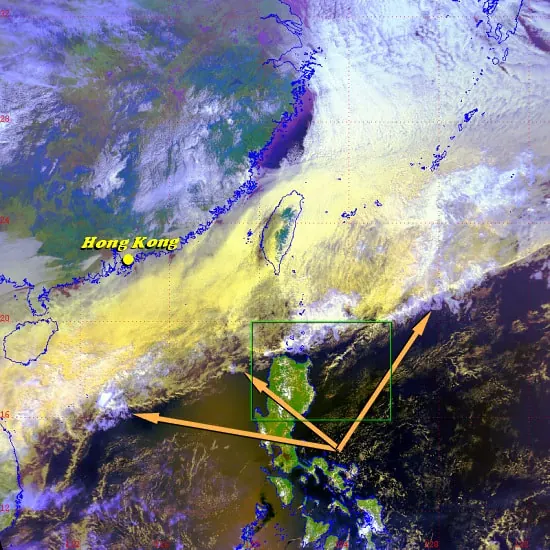 Cold Front on 7 March 2003
NOAA-16 satellite image taken at 1:36 p.m. shows a sharp cloud boundary marking a southward-moving cold front from the South China Sea to the Pacific. Clear skies appeared behind the front over Hong Kong and Guangdong.
Source: Hong Kong Observatory, www.hko.gov.hk
|
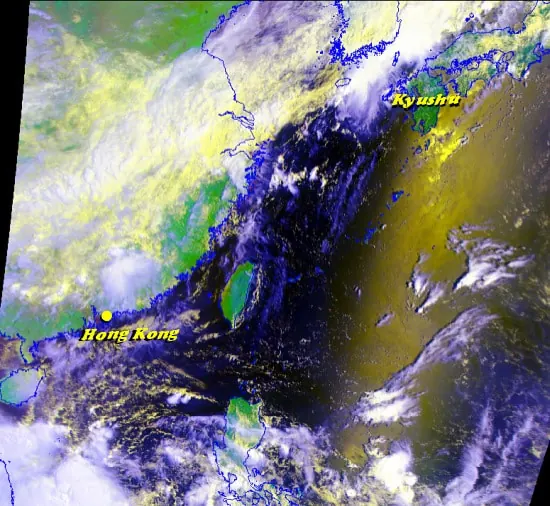 Fengyun‑1D Satellite Image, 15 August 2002
The image from China’s FY‑1D polar‑orbiting satellite—received by the Hong Kong Observatory at 8:41 a.m.—shows sunlight reflected south of Kyushu and various cloud and surface features highlighted.
Source: Hong Kong Observatory, www.hko.gov.hk
|
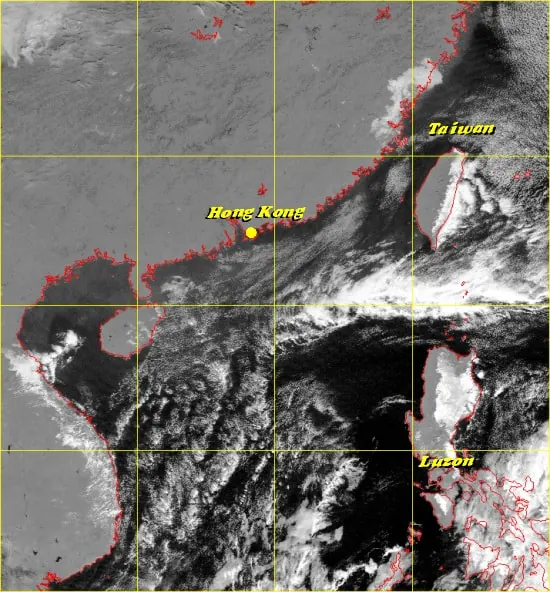 Föhn Effect over Luzon, 8 January 2002
A GMS‑5 satellite image taken at 10:32 a.m. shows clouds forming on the eastern (windward) side of Luzon and clear skies on the western (lee) side, illustrating the Föhn effect where descending air becomes warm and dry.
Source: Hong Kong Observatory, www.hko.gov.hk
|
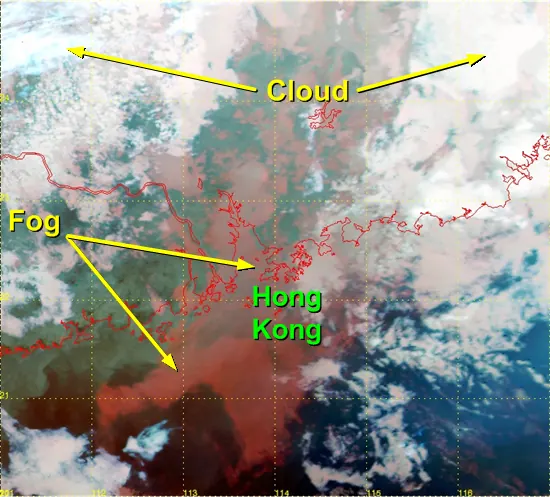 Fog over Pearl River Delta, 6 March 2006
EOS TERRA satellite image at 10:52 p.m. shows fog (red) shrouding Hong Kong, the Pearl River Delta, and nearby seas under moist airflow, with visibility dropping to 200 m at Chek Lap Kok. Processed using channels 20, 31, and 32 to distinguish fog/mist (smooth red) from clouds (white).
Source: Hong Kong Observatory, www.hko.gov.hk
|
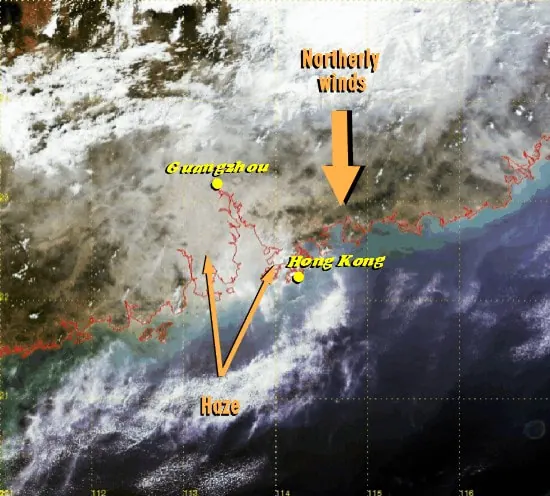 Image time - 11:20 a.m., 1 November 2004
The true colour image was captured by EOS TERRA satellite. This was generated by combining the satellite data. The image likens the view as seen by naked eyes from space.
|
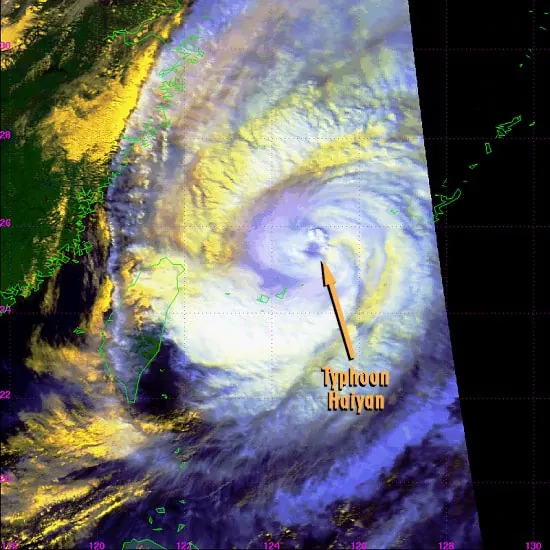 Typhoon Haiyan over the East China Sea, 16 October 2001
NOAA‑16 satellite image taken at 2:13 p.m. shows Typhoon Haiyan at peak intensity with a distinct eye and spiral cloud bands as it moved northeastward. Processed using channels 1, 2, and 4 to highlight cloud structures.
Source: Hong Kong Observatory, www.hko.gov.hk
|
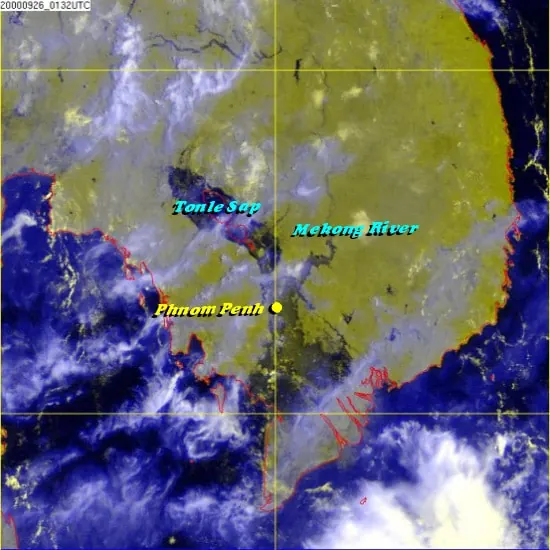 Southeast Asia Floods, 26 September 2000
GMS‑5 satellite image taken at 9:30 a.m. shows disastrous monsoon flooding across Thailand, Vietnam, Laos, and Cambodia, with dark areas marking inundated regions around Tonle Sap and Phnom Penh. Processed using VIS and IR1 channels to highlight floods (dark), clouds (white), and land/sea.
Source: Hong Kong Observatory, www.hko.gov.hk
|
Doppler Radar and Short-Range Forecasting
Doppler weather radar displays are typically presented as two main products: reflectivity and radial velocity. Reflectivity images use colour scales to show the intensity of returned radar signals from raindrops and other hydrometeors; higher reflectivity corresponds to heavier precipitation, allowing users to identify convective cells, squall lines, stratiform rain, and the eyewall and rainbands of tropical cyclones. Students can read these maps by locating high‑intensity cores (strong reds or purples in many colour schemes) as potential sources of heavy rain and lower‑intensity regions as lighter precipitation.
Radial velocity products show the component of wind along the line between the radar and the target. On these displays, one colour (for example, green or blue) is used for motion toward the radar, and another colour (such as red) is used for motion away from the radar, with the colour intensity indicating speed. Regions where colours change rapidly over short distances indicate strong shear; adjacent inbound and outbound regions can signal rotation, and bands of inbound flow next to bands of outbound flow can reflect the circulation of a tropical cyclone around its centre. Areas with near‑zero radial velocity (often shown in neutral colours) may indicate flow perpendicular to the radar beam or very weak winds.
By comparing reflectivity and radial‑velocity fields, students can infer both where rain is occurring and how the air is moving within and around precipitation systems. For example, low‑level convergence is indicated where opposing velocity colours meet under an area of high reflectivity, while divergence appears where colours indicating away‑from‑radar motion spread out under decaying echoes. Interpreting these patterns, in combination with surface and upper‑air charts and satellite imagery, allows for a more complete picture of weather systems and supports short‑range forecasting and warning decisions in Hong Kong.
Radial velocity products show the component of wind along the line between the radar and the target. On these displays, one colour (for example, green or blue) is used for motion toward the radar, and another colour (such as red) is used for motion away from the radar, with the colour intensity indicating speed. Regions where colours change rapidly over short distances indicate strong shear; adjacent inbound and outbound regions can signal rotation, and bands of inbound flow next to bands of outbound flow can reflect the circulation of a tropical cyclone around its centre. Areas with near‑zero radial velocity (often shown in neutral colours) may indicate flow perpendicular to the radar beam or very weak winds.
By comparing reflectivity and radial‑velocity fields, students can infer both where rain is occurring and how the air is moving within and around precipitation systems. For example, low‑level convergence is indicated where opposing velocity colours meet under an area of high reflectivity, while divergence appears where colours indicating away‑from‑radar motion spread out under decaying echoes. Interpreting these patterns, in combination with surface and upper‑air charts and satellite imagery, allows for a more complete picture of weather systems and supports short‑range forecasting and warning decisions in Hong Kong.
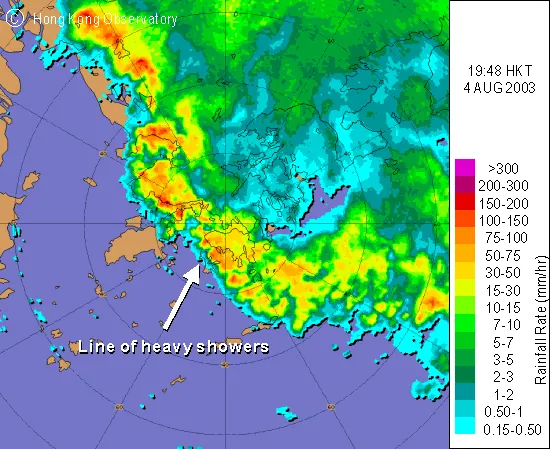 Gust Front over Hong Kong, 4 August 2003
Radar image shows a SE-NW line of heavy showers with a gust front bringing abrupt northeasterly winds (up to 70 km/h at Chek Lap Kok) ahead of the downpour, contrasting with background southwesterlies over western Lantau.
Source: Hong Kong Observatory, www.hko.gov.hk
|
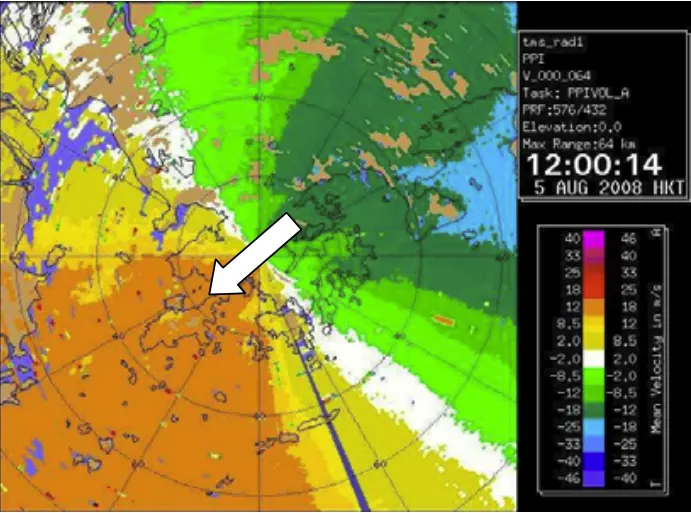 GMS radar 0° elevation PPI radial wind speed map from Tai Mo Shan at 12:00 shows Severe Tropical Storm Nuri affecting Hong Kong. White arrow indicates wind direction (~050°) inferred from the zero-speed line.
Source: Hong Kong Observatory, www.hko.gov.hk
|
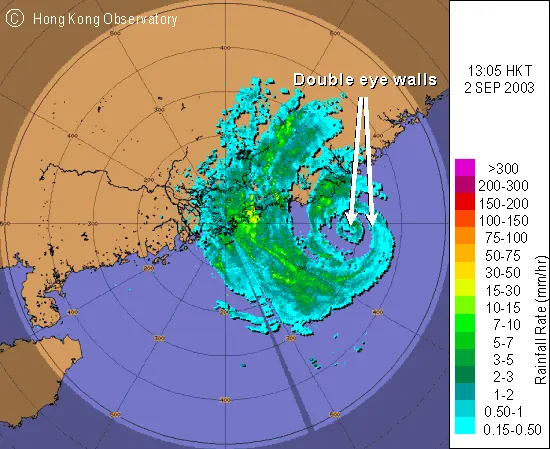 Typhoon Dujuan Double Eye-Wall, September 2003
Satellite image shows Typhoon Dujuan approaching Guangdong’s east coast with a double eye-wall structure (inner eye ~20 km, outer ~100 km diameter). Similar features seen in Typhoons Kujira (2003), Kirogi/Kai-Tak (2000), Elsie (1975), and Hope (1979).
Source: Hong Kong Observatory, www.hko.gov.hk
|
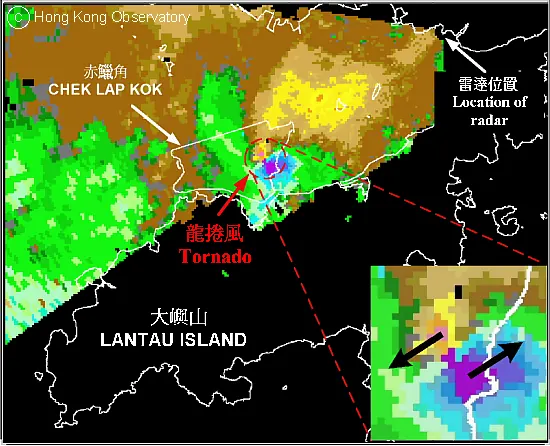 Tornado over Chek Lap Kok, 20 May 2002
Tai Lam Chung TDWR radar first captured a tornado with opposing winds >90 km/h over a 1 km area (top: purple/blue = NE winds, orange/yellow = SW winds); bottom reflectivity shows hook echo signature. Trees toppled and debris scattered.
Source: Hong Kong Observatory, www.hko.gov.hk
|
Activity: Become an AI Weather Scientist
Objective: Use real weather data from Hong Kong to train a machine learning model that can predict if it will rain today.
|
Step 1: Setup Your Lab (Make a Copy)
First, you need your own personal copy of the weather data so you can edit it.
|
 |
|
Step 2. Prepare the Data
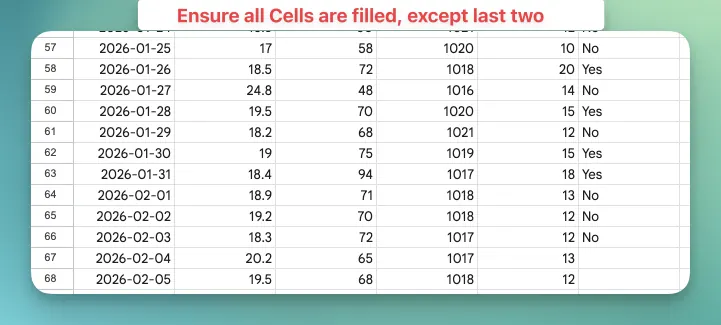
Machine Learning models need "clean" data. If there are holes in the data, the AI gets confused.
|
 |
|
Step 3. Install the Simple ML
We will use a tool called Simple ML for Sheets (created by the TensorFlow team at Google) to give your spreadsheet a "brain."
|
  |
|
Step 4. Train Your AI Model
Now it’s time to teach the AI what a "rainy day" looks like based on the last two months.
|
 |
 |
Step 5. Run the Prediction
Now that the AI is trained, let’s see if it can predict the weather for today.
Now that the AI is trained, let’s see if it can predict the weather for today.
- In the Simple ML sidebar, click the back arrow (top left) to return to the main menu.
- Select Predict missing values.
- For Column with empty cells, select Rain_Today.
- Click Predict.
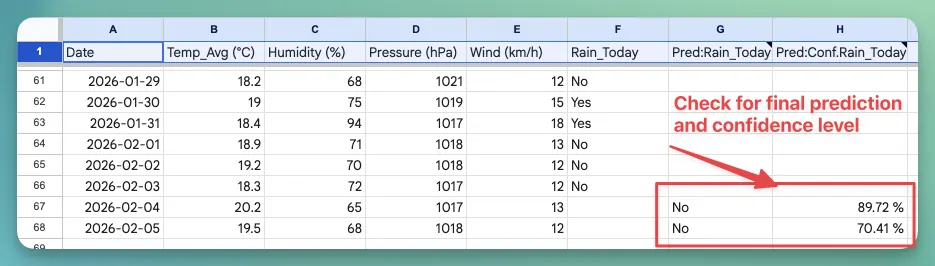
- Check the Result: Go to the bottom of your sheet. The AI will have filled in your empty cell with its guess! It also adds a Confidence column—how sure is the AI (e.g., 0.95 = 95% sure)?