The Building Blocks of Weather
|
Weather describes the state of the atmosphere at a given time and place. It originates from the interaction of three main elements: solar energy, atmospheric pressure, and moisture.
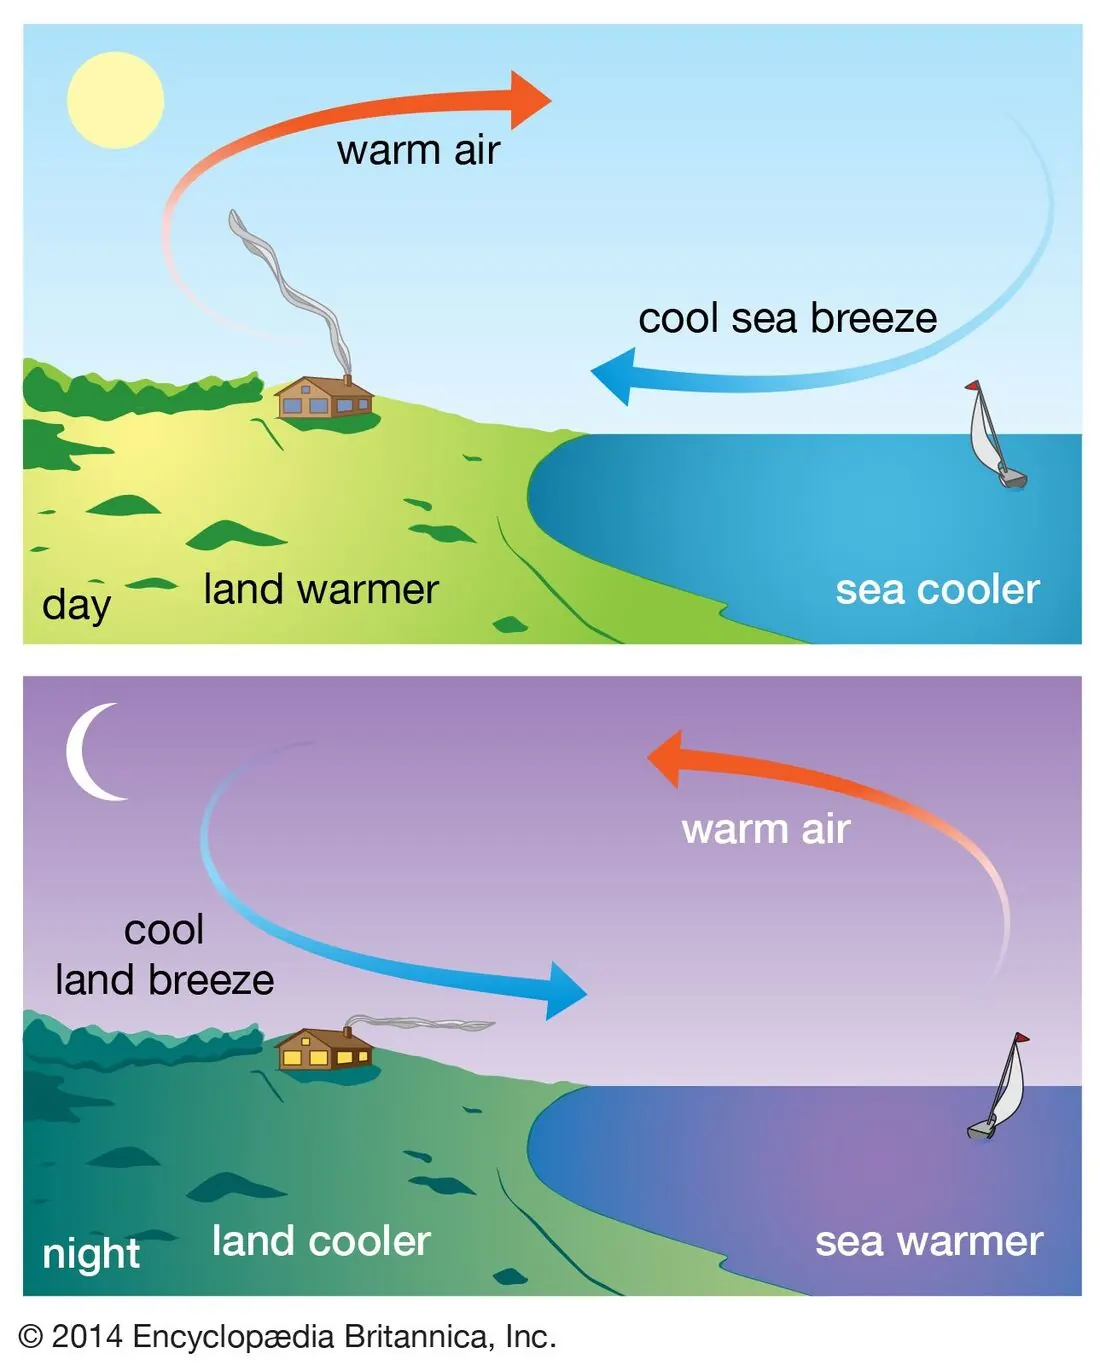
Solar radiation warms the Earth's surface unevenly—land heats and cools faster than water, and equatorial regions receive more direct sunlight than polar regions.
 |
 |
Pressure Regions and Isobars
Low and high pressure zones organize weather across large regions through differences in atmospheric pressure at sea level.
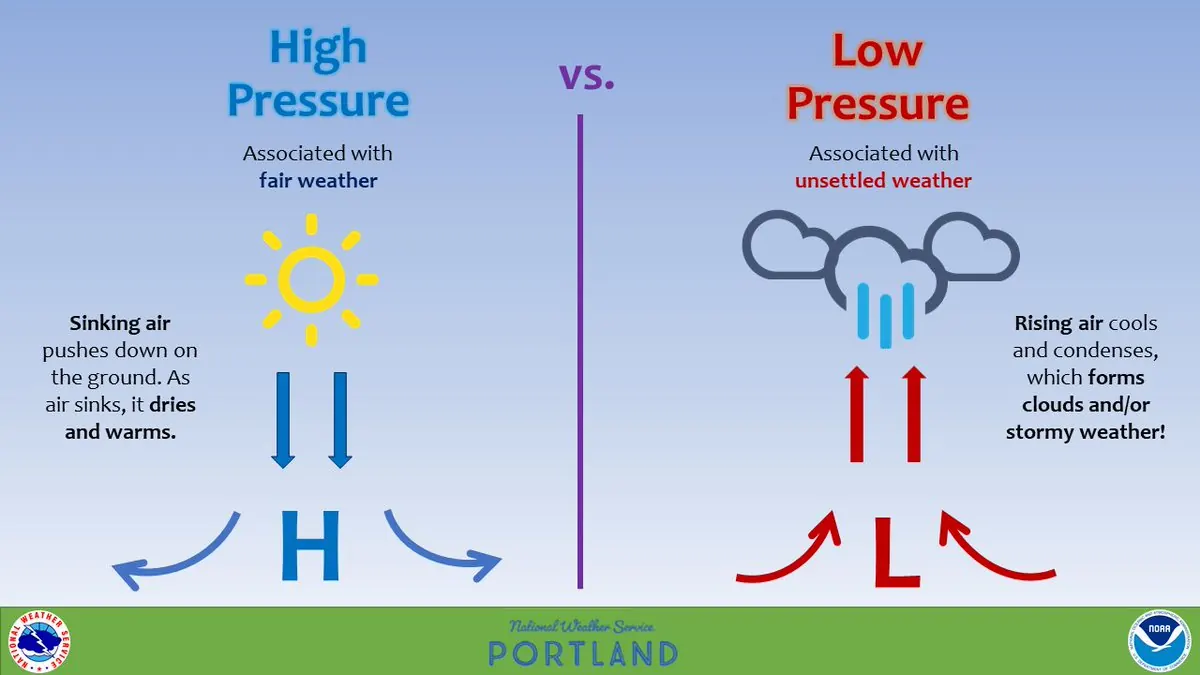
A low-pressure zone, or cyclone, is an area where the atmospheric pressure is lower than the surrounding environment. Air converges into a low and is forced to rise. As it rises, it expands and cools, often reaching its dew point and condensing to form clouds and precipitation. Thus, low-pressure systems are typically associated with unstable, cloudy, and potentially stormy weather. On a map, a low is marked with an "L." Major storm systems, including extratropical cyclones and the centers of tropical systems, are all low-pressure areas.
A high-pressure zone, or anticyclone, is an area where the atmospheric pressure is greater than the surrounding environment. Air within a high-pressure zone is typically descending. As it descends, it warms and its capacity to hold moisture increases, which generally inhibits cloud formation. Therefore, high-pressure systems are often associated with stable, clear, and calm weather conditions. On a surface weather map, a high is marked with an "H."
A low-pressure zone, or cyclone, is an area where the atmospheric pressure is lower than the surrounding environment. Air converges into a low and is forced to rise. As it rises, it expands and cools, often reaching its dew point and condensing to form clouds and precipitation. Thus, low-pressure systems are typically associated with unstable, cloudy, and potentially stormy weather. On a map, a low is marked with an "L." Major storm systems, including extratropical cyclones and the centers of tropical systems, are all low-pressure areas.
A high-pressure zone, or anticyclone, is an area where the atmospheric pressure is greater than the surrounding environment. Air within a high-pressure zone is typically descending. As it descends, it warms and its capacity to hold moisture increases, which generally inhibits cloud formation. Therefore, high-pressure systems are often associated with stable, clear, and calm weather conditions. On a surface weather map, a high is marked with an "H."
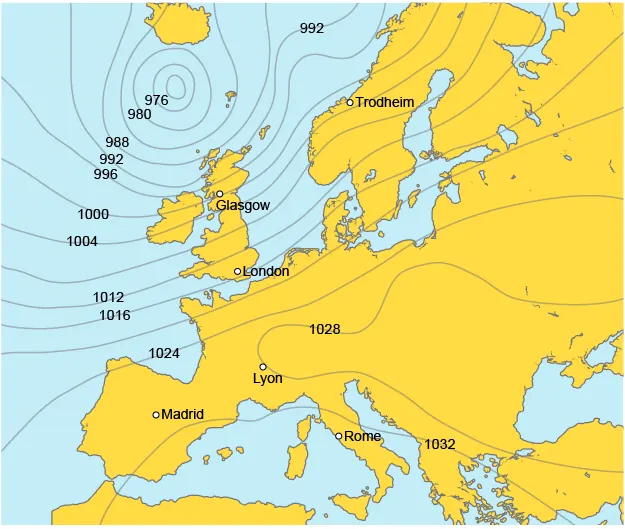
Isobar maps use contour lines, called isobars, to connect points of equal sea-level pressure, typically in millibars or hectopascals, revealing pressure patterns at a glance. Widely spaced isobars indicate light winds and gradual pressure changes, while tightly packed isobars show strong winds and steep gradients
The Nature of Wind
|
Wind is the movement of air across the Earth's surface. Fundamentally, it acts as a mechanism for equalizing differences in atmospheric pressure. Air naturally moves from areas of higher pressure toward areas of lower pressure. This movement is not random; its characteristics are defined by the pressure gradient.
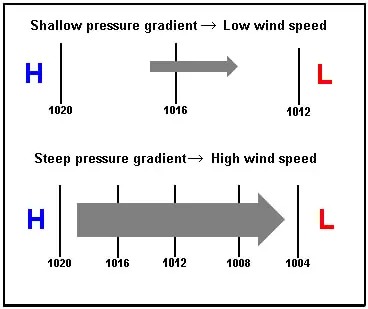
A steep pressure gradient, where isobars (lines of equal pressure) are closely spaced on a weather map, indicates a strong force and results in high wind speeds. A gentle gradient, with widely spaced isobars, results in lighter winds. The initial direction of the wind, due solely to the pressure gradient force, is perpendicular to the isobars, moving directly from high to low pressure. |
 |
Temperature, Humidity, and Atmospheric Moisture Indicators
Moisture enters the atmosphere through evaporation from oceans, lakes, and soil. When this warm, moist air rises and cools, the water vapor may condense to form clouds and precipitation. This continuous cycle of heating, pressure change, and moisture transport establishes the basic conditions from which all weather develops. Here are some common terminology you may likely hear from a weather report.
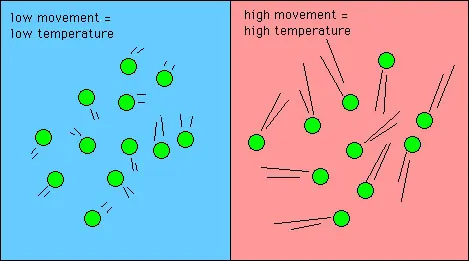
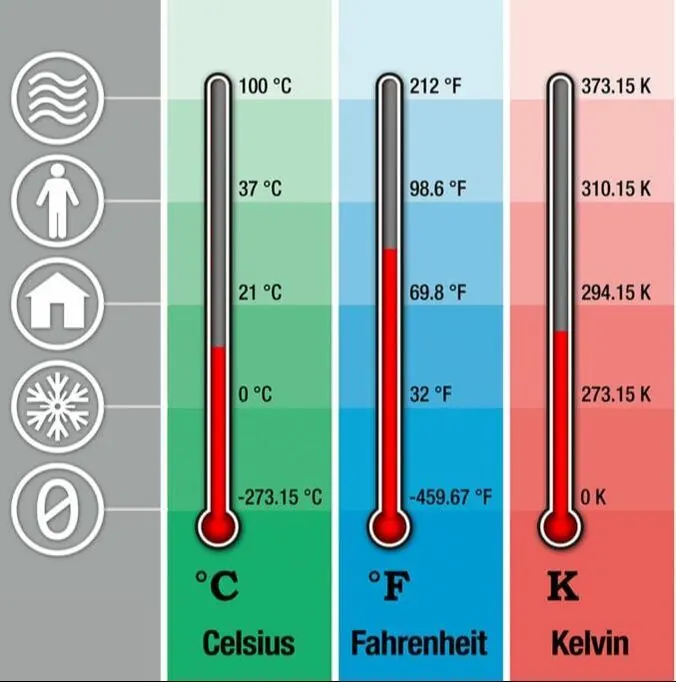
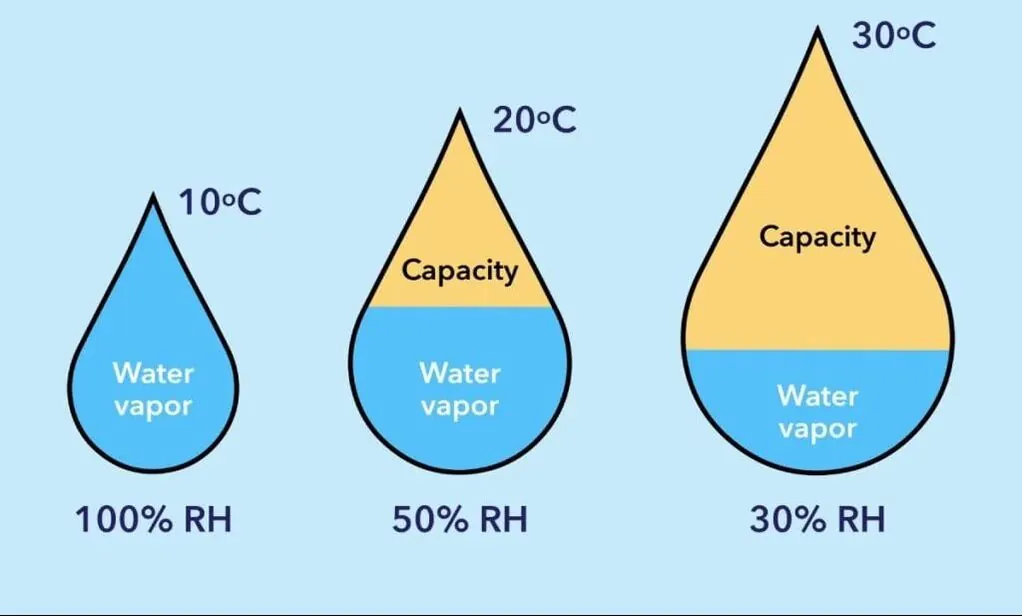
- Temperature measures the air's thermal energy, influencing how readily air rises or sinks—warm air rises faster due to lower density. It is a primary driver of weather, influencing air pressure, wind patterns, and the capacity of the atmosphere to hold moisture. As air temperature increases, its ability to hold water vapor also increases.
 |
 |
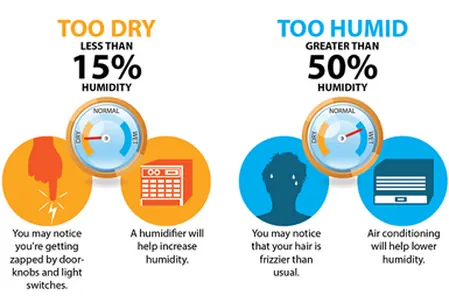
- Relative humidity shows the percentage of moisture air holds compared to its maximum capacity at that temperature. A relative humidity of 100% indicates the air is saturated, and further cooling will typically lead to condensation.
 |
 |
- Dew point (condensation temperature) indicates the temperature at which air becomes saturated with water and condensation begins.
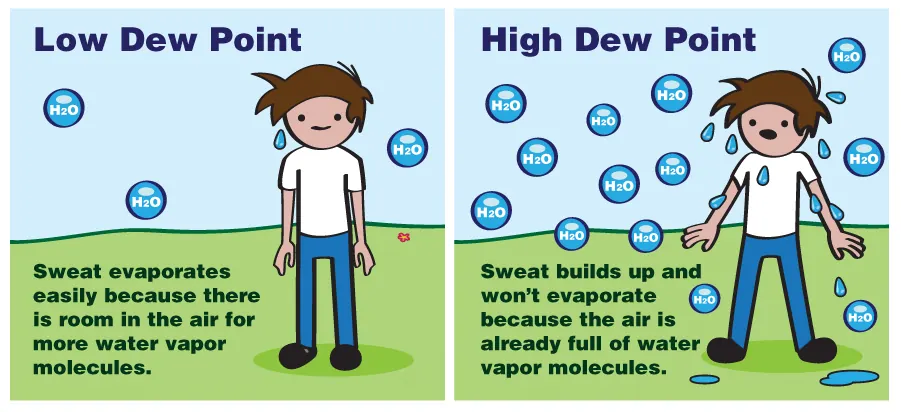
- A low dew point signifies dry air, where the temperature and dew point are far apart, resulting in low relative humidity, clear skies, a low chance of precipitation, and a perception of dry, comfortable conditions.
- Conversely, a high dew point indicates moist air, with the temperature and dew point close together, leading to high relative humidity. This moisture-laden air readily condenses with slight cooling, promoting cloud formation, fog, and precipitation, while creating a muggy, less comfortable feeling as the body's ability to cool through evaporation is reduced.
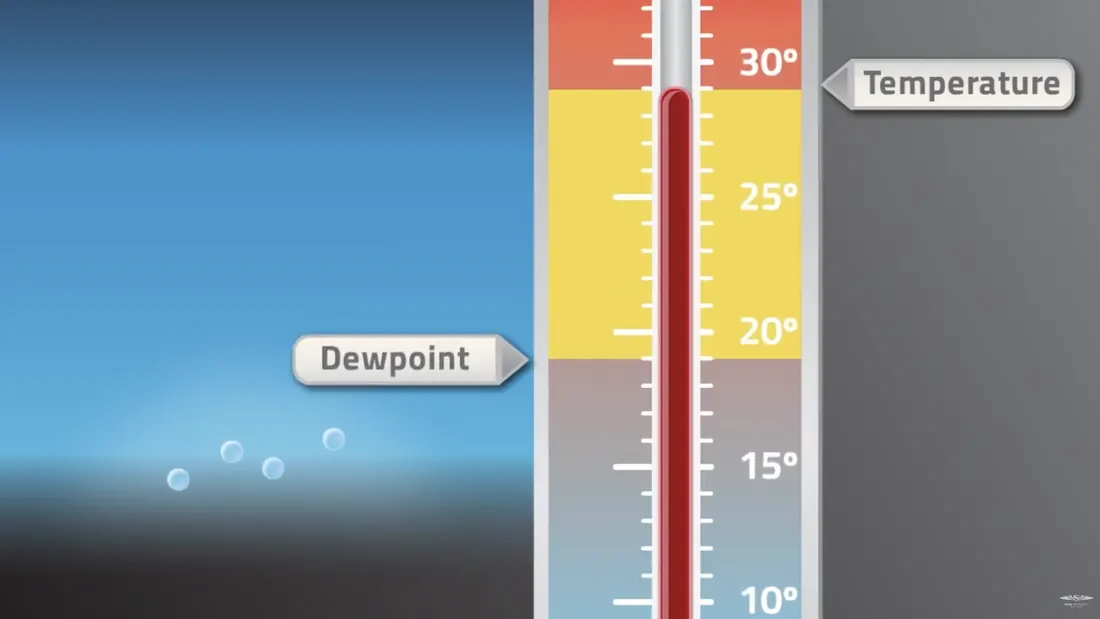 Water stays as vapour if there difference between the air temperature and the dew point is large.
|
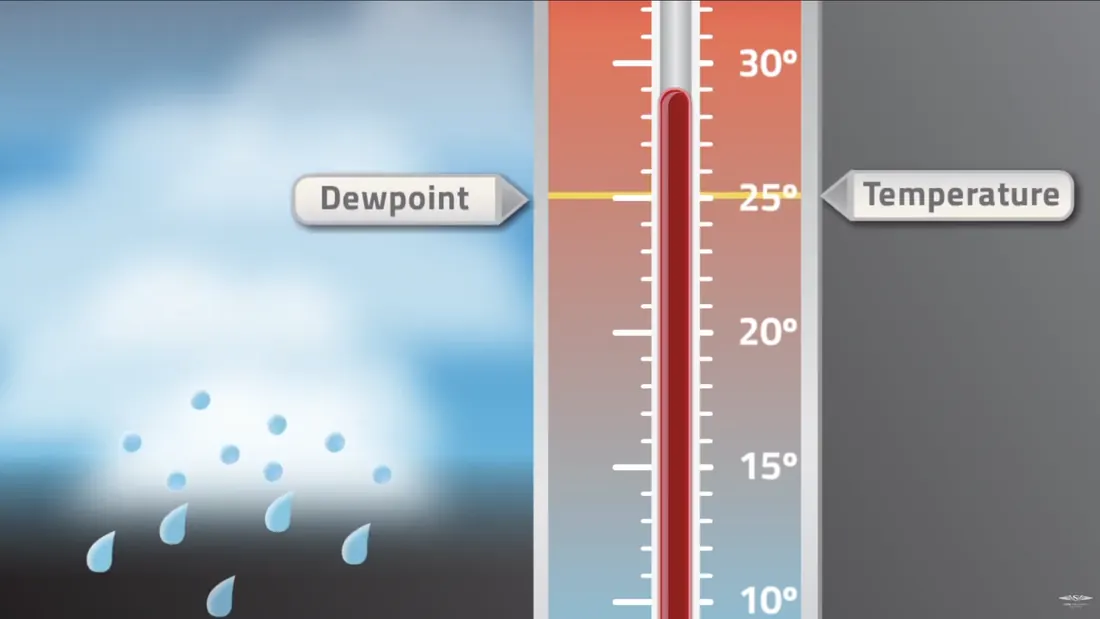 Water condense into liquid if there difference between the air temperature and the condensation temperature diminishes.
|
 |
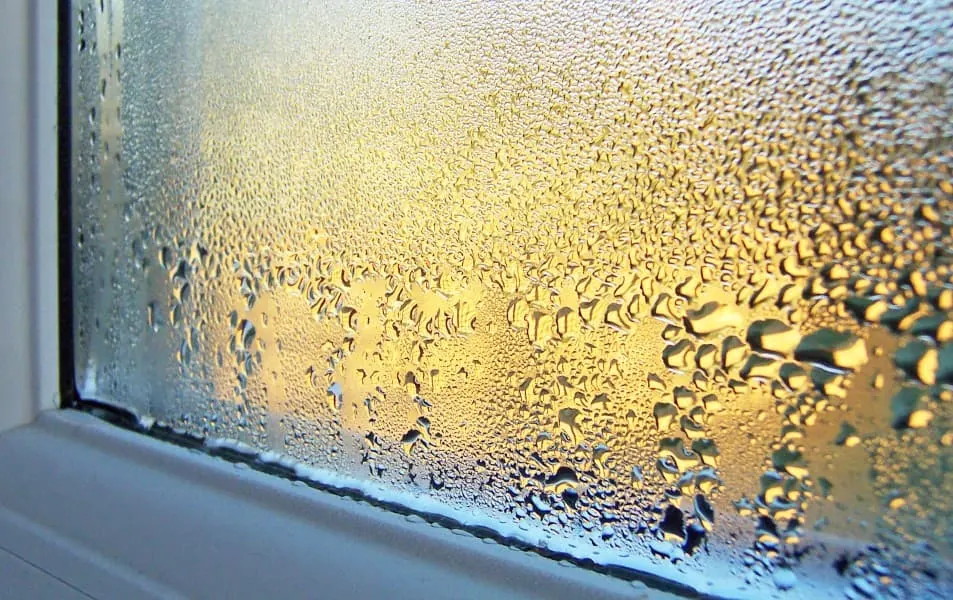 As the temperature approaches the dew point, condensation forms.
|
When moist air rises and cools to its dew point, water vapor condenses into tiny droplets or ice crystals, forming clouds and precipitation. These processes produce daily weather patterns observed globally. Pilots monitor these via METAR reports—for example, a temperature of 20°C and dew point of 18°C indicates high humidity and risk of low visibility.
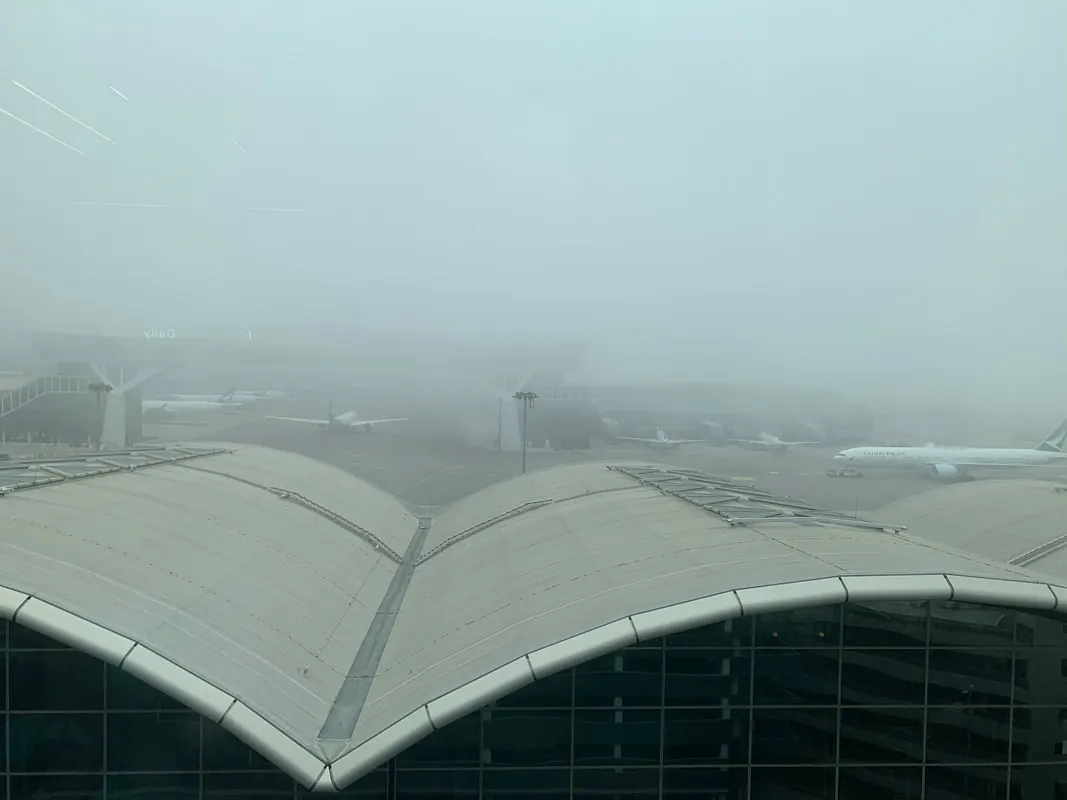
Low air temperature with high dew point results in fog.
Types of Clouds and Atmospheric Stability
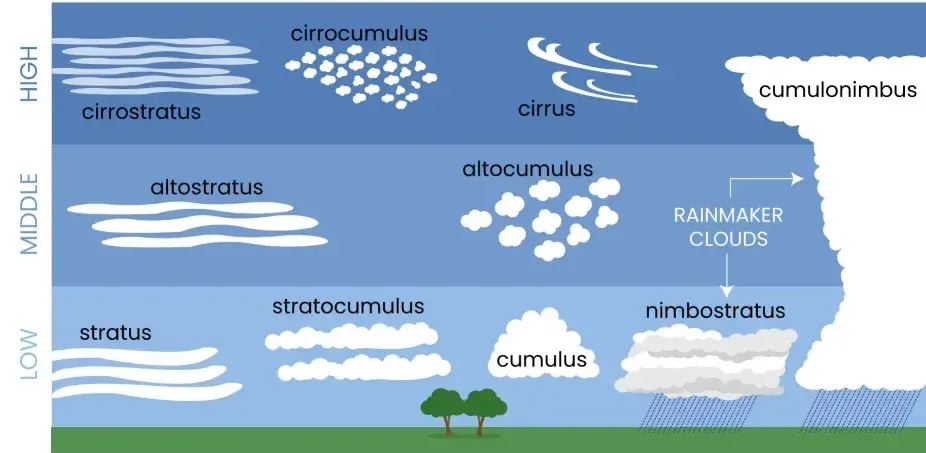
Clouds appear in three main categories--stratiform, cumuliform, and cirriform—each reflecting specific atmospheric conditions tied to temperature, humidity, and stability.
Atmospheric stability determines cloud growth: stable conditions limit vertical motion and favor layered clouds, while unstable conditions—marked by steep temperature lapse rates—promote towering development and precipitation.
- Stratiform clouds, such as stratus and nimbostratus, appear as extensive, flat layers or sheets. They generally form in stable atmospheric conditions and are often associated with widespread, continuous light rain or drizzle.
- Cumuliform clouds have a puffy, cauliflower-like appearance with significant vertical development, signaling atmospheric instability. Fair-weather cumulus are detached, individual clouds with flat bases. Cumulonimbus clouds represent the most developed form. These massive, towering clouds can extend from low altitudes to the upper troposphere. They are directly associated with thunderstorms and can produce intense, showery precipitation, lightning, hail, and strong, gusty winds. The presence of cumulonimbus clouds indicates a high degree of atmospheric instability and turbulent conditions.
- Cirriform clouds, like cirrus and cirrostratus, are thin, wispy, and composed of ice crystals at high altitudes. They often appear in advance of a weather front and can indicate a change in the weather pattern.
Atmospheric stability determines cloud growth: stable conditions limit vertical motion and favor layered clouds, while unstable conditions—marked by steep temperature lapse rates—promote towering development and precipitation.
Tropical Cyclones, Typhoons, Hurricanes
Tropical cyclones, known as typhoons in the northwest Pacific, hurricanes in the Atlantic, or cyclones elsewhere, form over warm ocean waters above 26.5°C where high humidity fuels sustained winds exceeding 119 km/h.
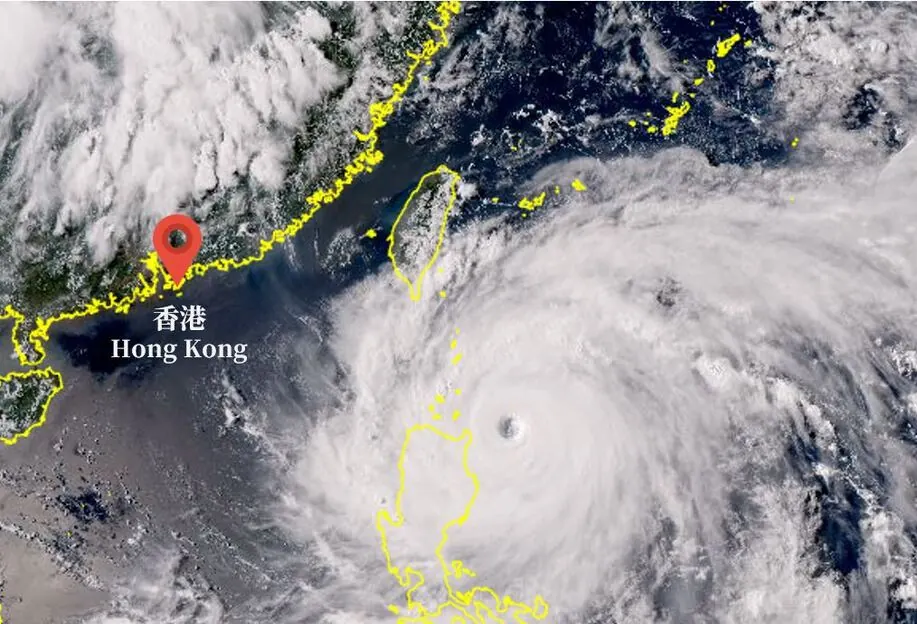
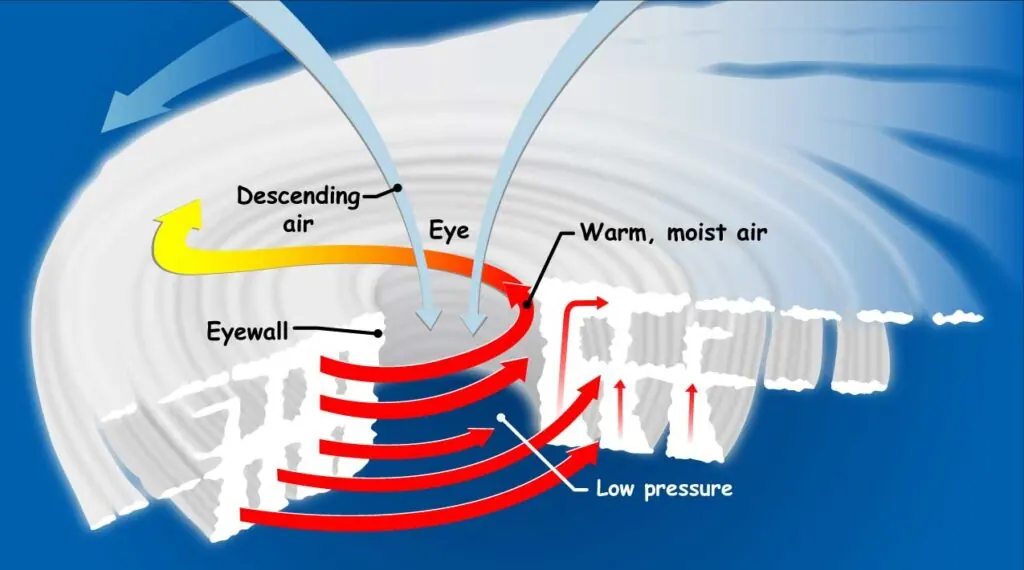
A low-level circulation draws in moist air that rises, cools to its dew point, and condenses, releasing heat that strengthens the system into a central eye surrounded by a wall of towering cumulonimbus clouds and rain bands. The storm's spiral structure spans 100-500 km, with the calm eye featuring clear skies and sinking air, contrasting the intense weather in the eyewall where updrafts exceed 20 m/s. These systems last days to weeks, moving with steering winds aloft, and dissipate over land or cooler water when their heat-moisture supply ends. Satellite views reveal their full structure, aiding track forecast.
A low-level circulation draws in moist air that rises, cools to its dew point, and condenses, releasing heat that strengthens the system into a central eye surrounded by a wall of towering cumulonimbus clouds and rain bands. The storm's spiral structure spans 100-500 km, with the calm eye featuring clear skies and sinking air, contrasting the intense weather in the eyewall where updrafts exceed 20 m/s. These systems last days to weeks, moving with steering winds aloft, and dissipate over land or cooler water when their heat-moisture supply ends. Satellite views reveal their full structure, aiding track forecast.
 |
 |
Satellite Observation Systems
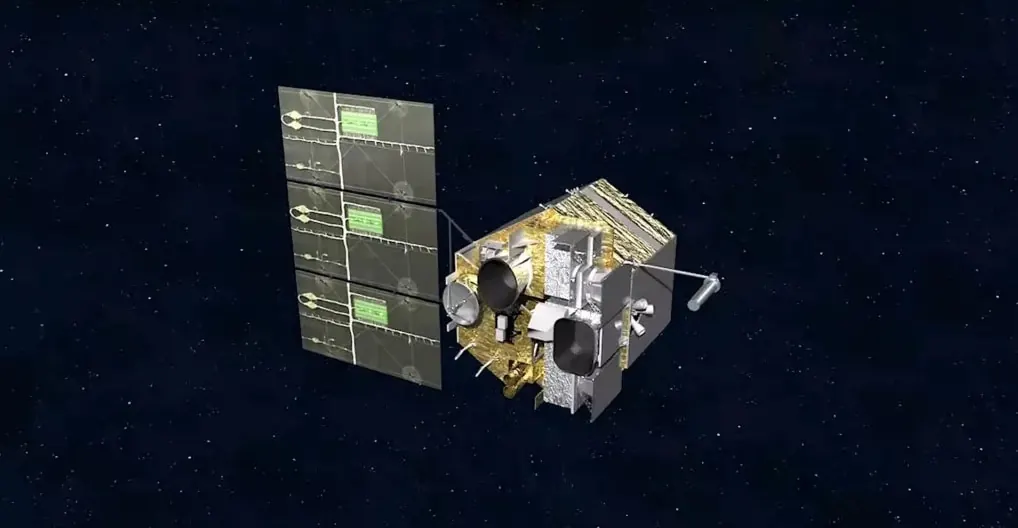
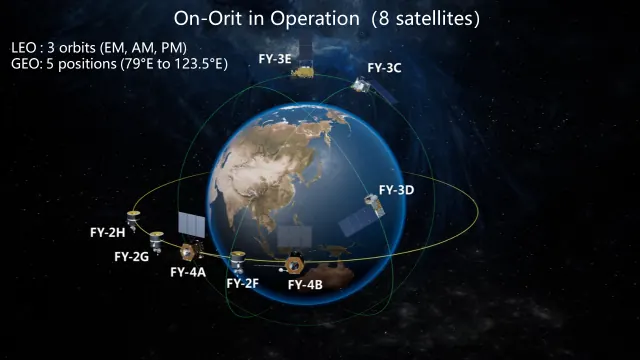
Satellite technology provides essential data for weather analysis through two primary orbit types. Geostationary satellites, positioned 36,000 km above the equator, maintain a fixed view of one region and deliver frequent visible-light images of cloud cover every 10-15 minutes, plus infrared imagery revealing cloud-top temperatures, storm intensity, and tropical cyclone eyes at night. Polar-orbiting satellites, circling Earth from pole to pole at 800-1,000 km altitude, pass over each location twice daily and use infrared and microwave sensors to measure vertical profiles of temperature, humidity, dew point spreads, and wind speeds through the atmosphere. These platforms capture data on moisture distribution, storm tracks, and upper-air patterns that ground stations cannot reach, including cyclone development over oceans.
Activity: Mapping Weather with AI
 |
Generate Different Climate Landscapes using Gemini AI model
The goal of this experiment is to determine if an AI can accurately visualize a location's landscape based solely on real-time atmospheric data. |
|
Step 1: Data Collection
Step 2: The AI Prompt Copy and paste the following prompt into Gemini, filling in the blanks with your collected data: "I am looking at a live map where the Temp is [Value]°C and the Dew Point is [Value]°C, with a wind heading towards [Degrees]° at a speed of [Value] km/h. Generate an image of what a landscape would look like in this exact spot." Step 3: Verification Compare the AI-generated image against the actual geography of those coordinates (using Google Earth or satellite imagery).
|
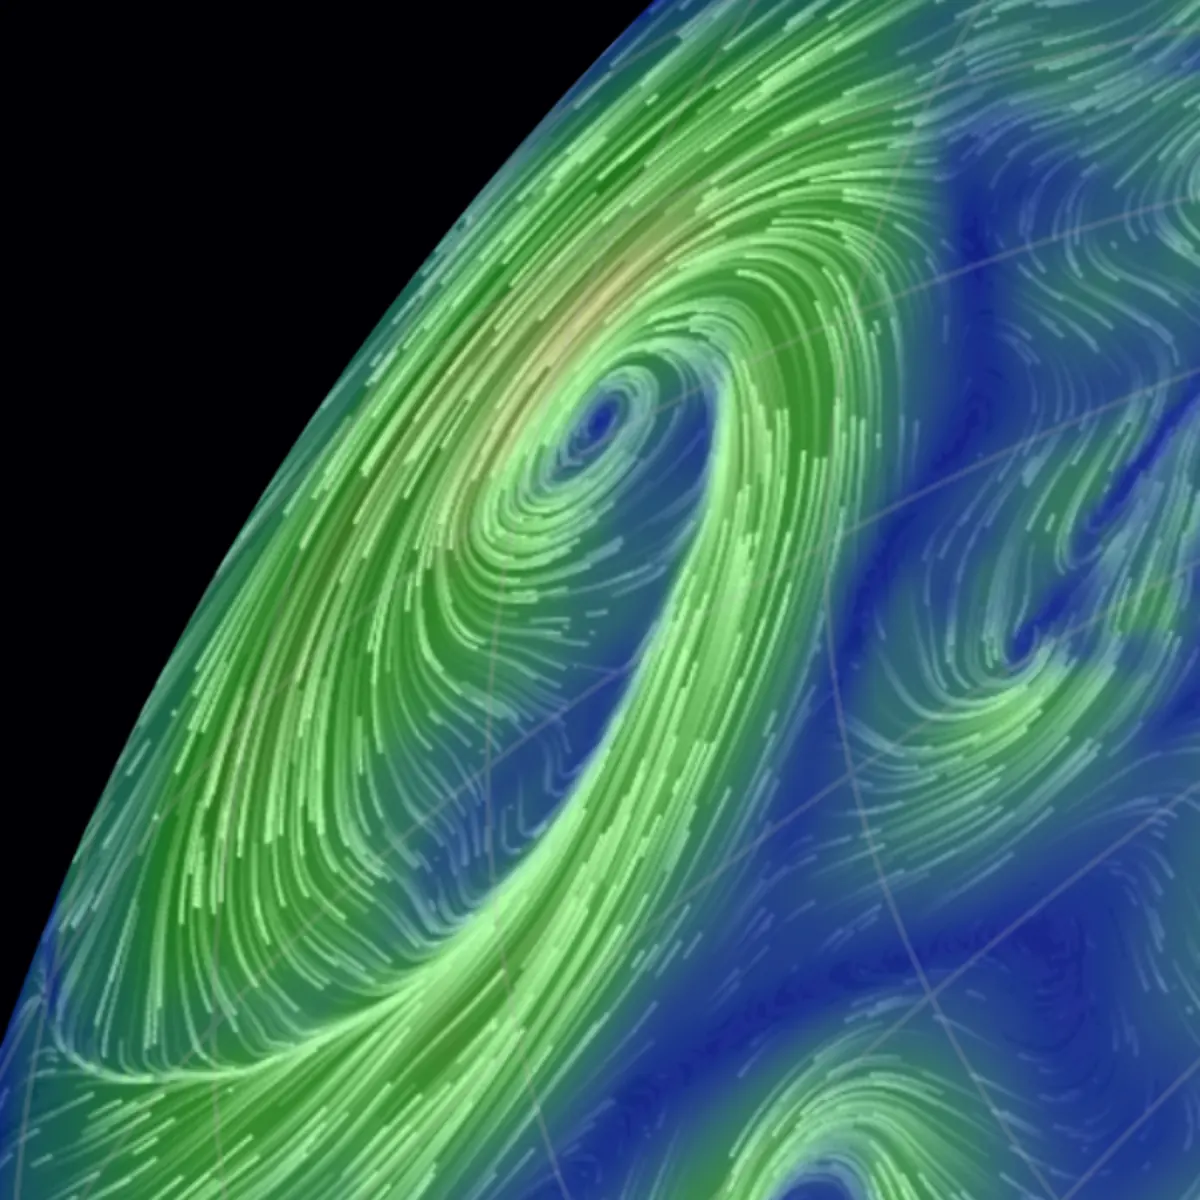 Click image icon to go to website.
 Click image icon to go to website.
|