The Birth of a Star: From Dust to Light
|
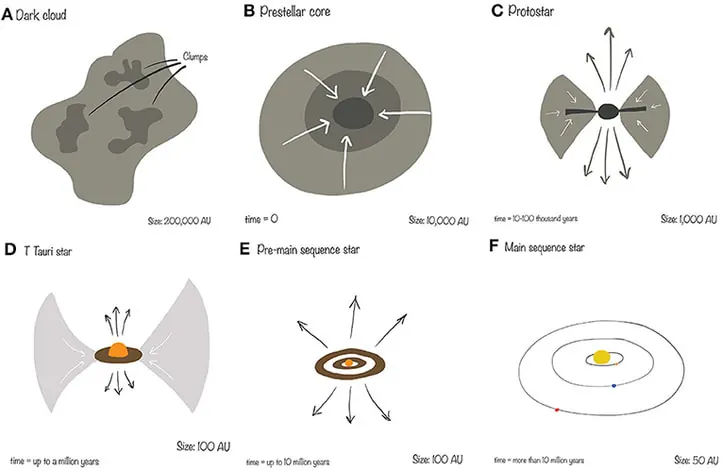
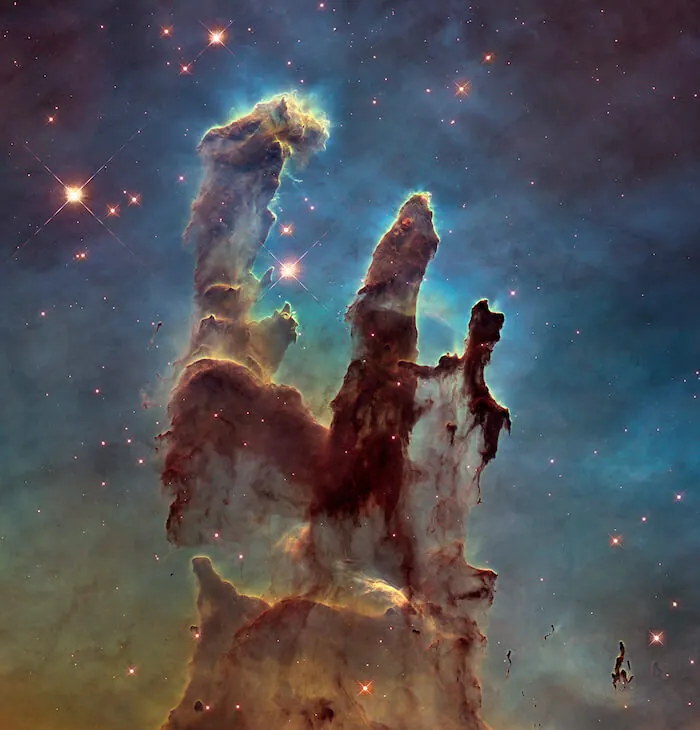
Stars begin their lives within vast, cold clouds of gas and dust in space called nebulae, often referred to as stellar nurseries. These clouds, primarily composed of hydrogen and helium, can exist in a stable state for long periods. However, a disturbance, such as the shockwave from a nearby supernova or the gravitational pull of a passing galaxy, can cause a region within the nebula to collapse under its own gravity.
As this pocket of gas contracts, it spins and flattens into a rotating disk, with most material falling into the center to form a hot, dense core called a protostar. Over millions of years, the pressure and temperature at the core of the protostar become so high that nuclear fusion ignites, converting hydrogen into helium and releasing energy. At this point, the outward pressure from fusion balances the inward pull of gravity, and a stable star is born. |
 |
The Hertzsprung-Russell Diagram
Astronomers use the Hertzsprung–Russell (H–R) diagram to organize and interpret these different stages of stellar life by plotting stars according to their luminosity (or absolute magnitude) and surface temperature (or colour).
- On this diagram, most stars lie along the main sequence, running from hot, blue, luminous stars in the upper left to cool, red, dim stars in the lower right.
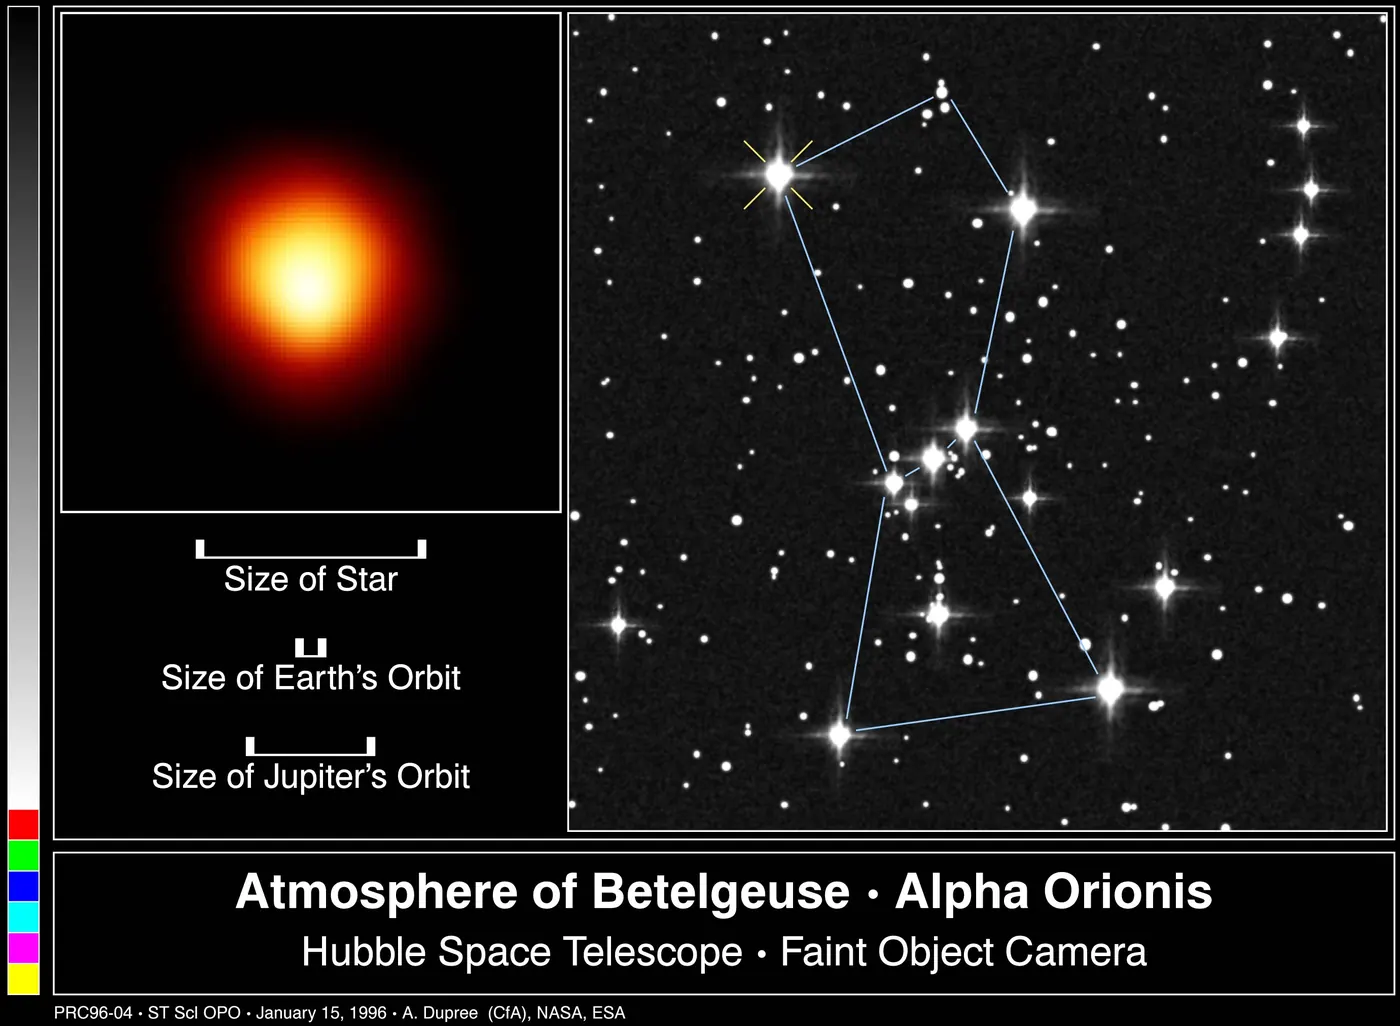
- Above and to the right of the main sequence are giant and supergiant stars, which are larger and brighter but cooler at the surface, often representing later evolutionary phases after the core hydrogen is exhausted.
- In the lower left lies the white dwarf region, where hot but faint stellar remnants appear after low- and intermediate-mass stars have shed their outer layers and no longer sustain core fusion.
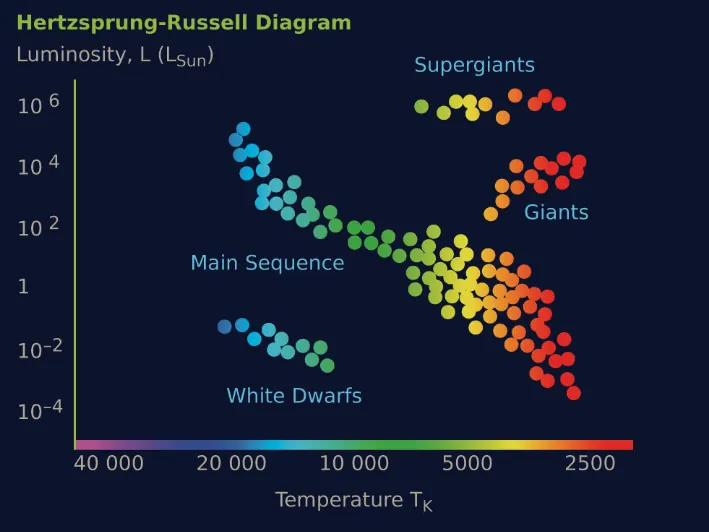
- The Vertical Axis (Up/Down): Measures Luminosity. The higher the star is on the chart, the brighter it is.
- The Horizontal Axis (Left/Right): Measures Temperature. On this graph, the hot (blue) stars are on the left, and the cool (red) stars are on the right.
From a point in the diagram, to knowing what it is
To use it, astronomers first measure how bright a star really is (its luminosity or absolute magnitude) and how hot its surface is (from colour or spectrum), then place it at the point where those two values meet on the diagram. The region where a star sits tells whether it is small and dense, large and diffuse, young on the main sequence, or in a later phase like a giant or white dwarf.
Activity: Star Walk 2
Stars you see in the night sky are not all the same. Some are hot and blue, some are cool and red, and some are much brighter than others. In this activity you will use the app Star Walk 2 to explore real stars above you and connect what you see to what you have learned about the H–R diagram and stellar evolution.
|
1. Choose a star in Star Walk 2
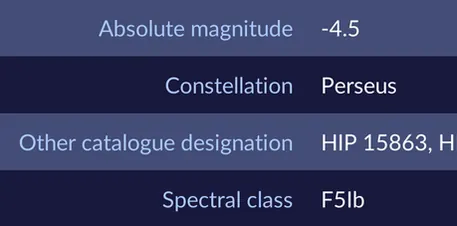
Open Star Walk 2, point at the sky, tap one bright star, and write down: star name, spectral class letter (O, B, A, F, G, K, M), and absolute magnitude. 2. Turn the data into colour and brightness Use a Spectral class:
3. Place the star on the H–R diagram Find the correct colour band (blue, white, yellow, orange, red) on the diagram, then put a dot high, middle, or low in that band for the brightness, and label it with the star’s name. 4. Say what it means Write one sentence, for example: “Our star is blue and very bright, so it is hot, big, and uses its fuel quickly,” or “Our star is red and dim, so it is cool, small, and lives a long time.” |
  |