Observed Climate Change in Hong Kong
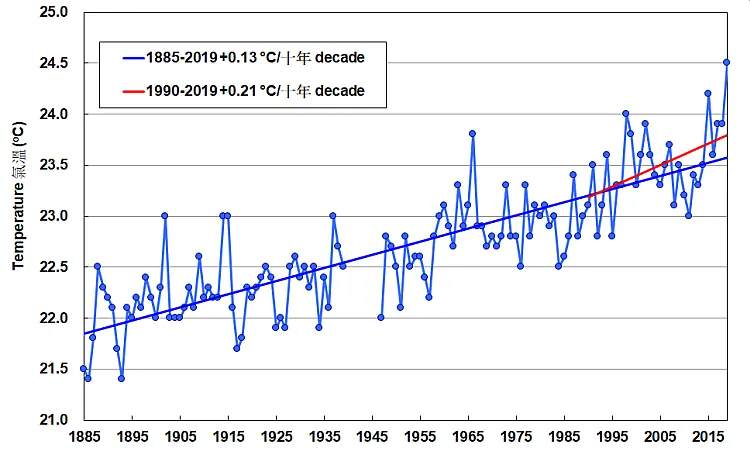
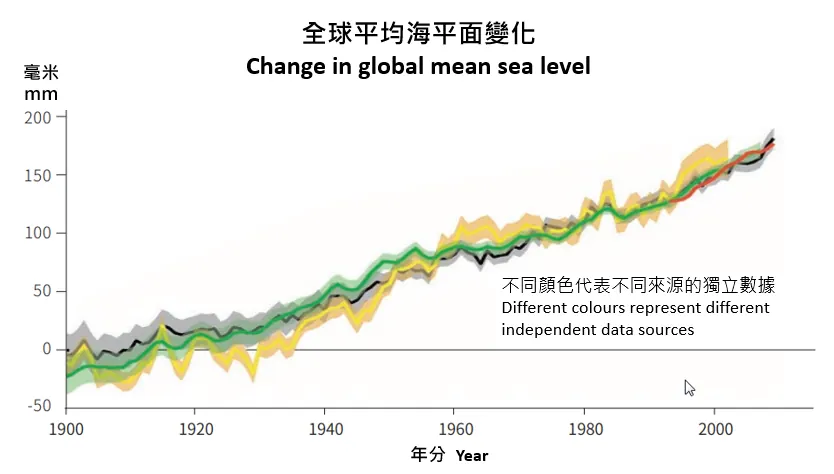
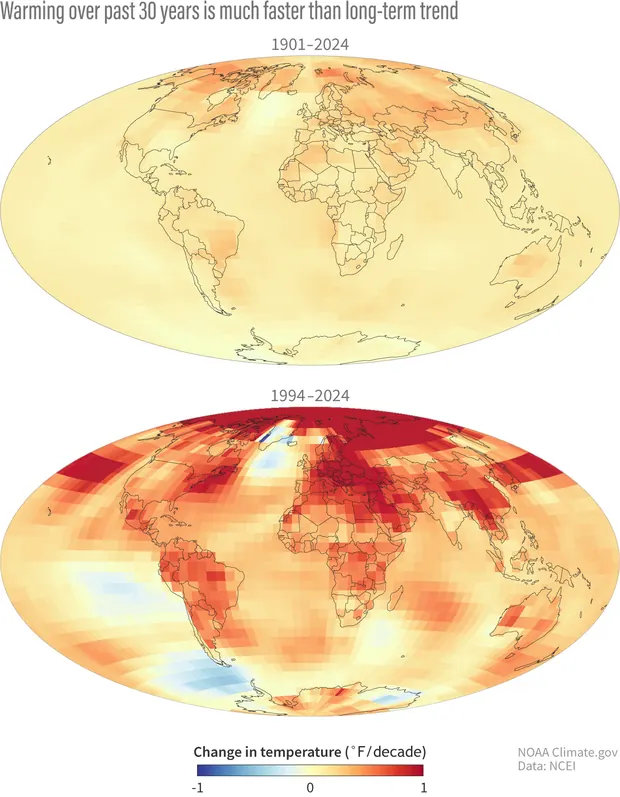
Hong Kong is experiencing measurable changes in its climate. Since 1885, the average temperature has risen at a rate of 0.14°C per decade, with the rate of increase accelerating to 0.30°C per decade between 1994 and 2023. Sea level in Victoria Harbour has risen steadily, increasing by an average of 31 millimetres per decade from 1954 to 2023.
 https://www.hko.gov.hk/en/climate_change/obs_hk_temp.htm
|
 https://www.hko.gov.hk/en/climate_change/proj_hk_temp.htm
|
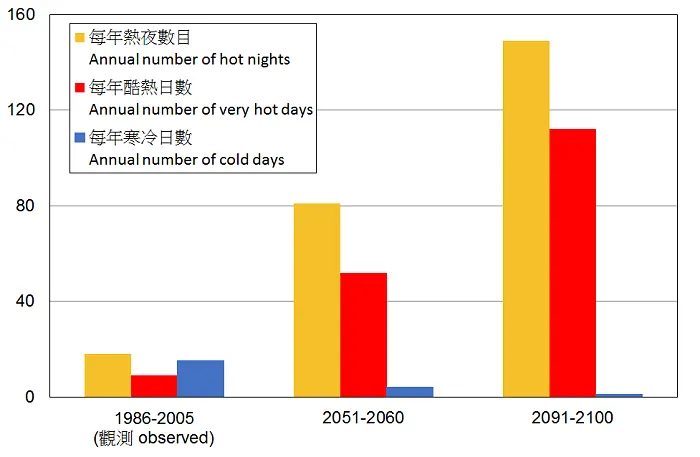
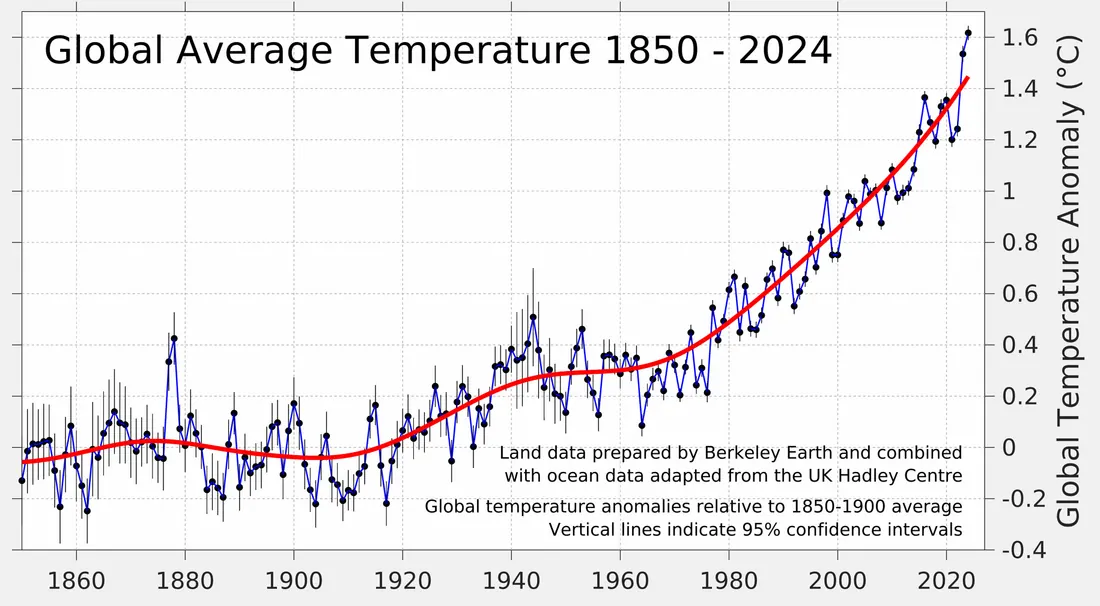
The year 2025 was the sixth warmest on record since 1884, with an annual mean temperature of 24.3°C, which is 0.8°C above the long-term average. The city experienced 53 very hot days and 54 hot nights, both ranking as the third highest on record. These increases can be understood through the lens of global climate change. As greenhouse gas concentrations rise, more energy is trapped in the Earth system. This increases average temperatures and makes extreme heat events more frequent and intense.
 https://www.hko.gov.hk/en/climate_change/proj_hk_rainfall.htm
|
 https://www.hko.gov.hk/en/climate_change/obs_global_sea_level.htm
|
The number of tropical cyclones affecting Hong Kong in 2025 was unprecedented, with 14 cyclones requiring tropical cyclone warning signals--more than double the long-term average of about six per year. Among these were two cyclones that triggered the Hurricane Signal No. 10, the highest warning level.
While the total number of tropical cyclones forming in the western North Pacific has not shown a clear long-term trend, research suggests that climate change may be altering their behaviour. Warmer ocean waters provide more energy for storms, potentially leading to higher intensity. Changes in large-scale atmospheric circulation patterns may also be steering more storms toward particular regions in certain years.
While the total number of tropical cyclones forming in the western North Pacific has not shown a clear long-term trend, research suggests that climate change may be altering their behaviour. Warmer ocean waters provide more energy for storms, potentially leading to higher intensity. Changes in large-scale atmospheric circulation patterns may also be steering more storms toward particular regions in certain years.
Global Mechanisms Behind Climate Change
The Earth's climate is influenced by the balance between incoming solar radiation and outgoing infrared radiation. Certain gases in the atmosphere, known as greenhouse gases, trap some of this outgoing radiation and re-radiate it back toward the surface. This natural greenhouse effect keeps Earth's average temperature about 33°C warmer than it would otherwise be, making life possible.
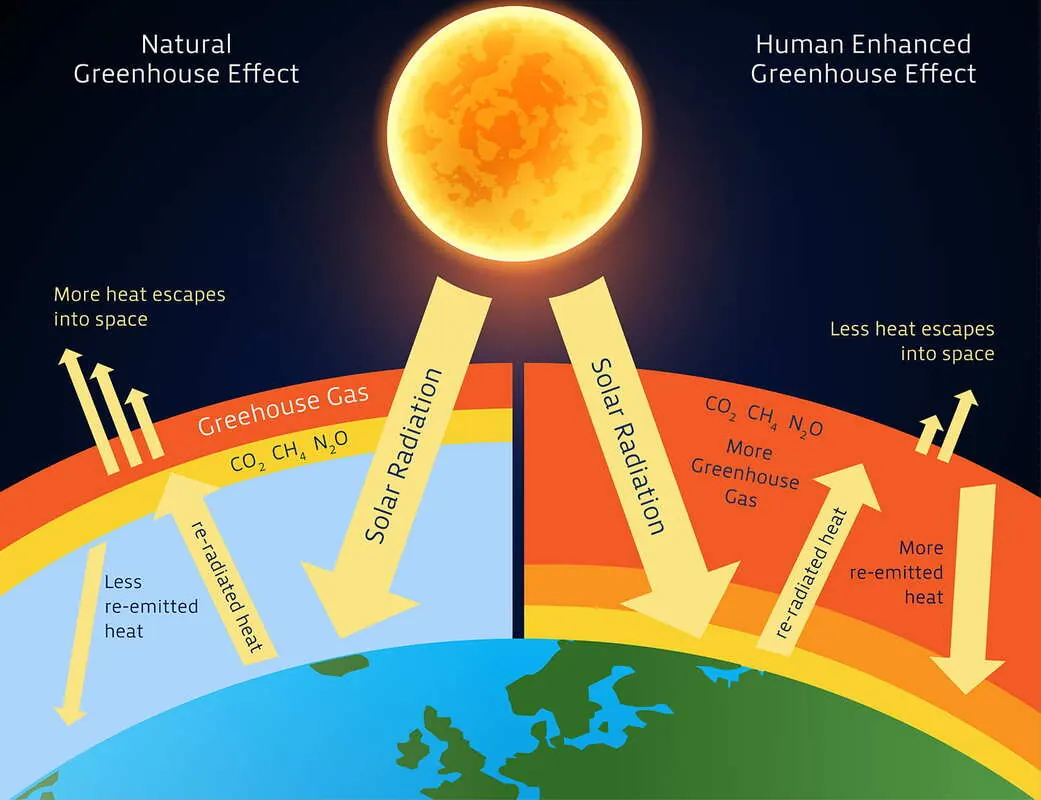
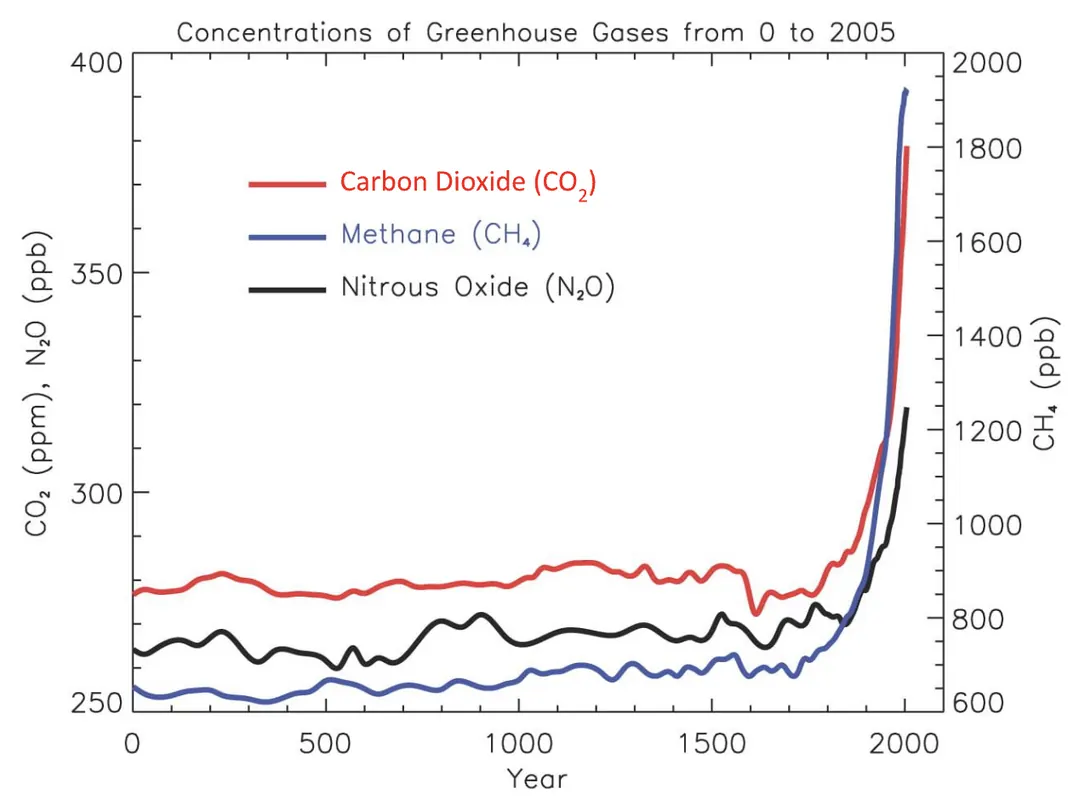
Human activities since the Industrial Revolution have increased the concentration of greenhouse gases in the atmosphere. Burning fossil fuels releases carbon dioxide, agriculture releases methane, and industrial processes release various other gases. These additional gases enhance the natural greenhouse effect, causing more energy to be retained in the Earth system. The result is a gradual increase in global average temperatures, a phenomenon known as global warming.
As of 2022, the Earth's Energy Imbalance reached 1W/m^2, equals to 800,000 Hiroshima atomic bombs per day, every day. As long as EEI is positive, Earth will continue to get hotter.
As of 2022, the Earth's Energy Imbalance reached 1W/m^2, equals to 800,000 Hiroshima atomic bombs per day, every day. As long as EEI is positive, Earth will continue to get hotter.
This additional energy alters the entire climate system, affecting atmospheric circulation, ocean currents, the water cycle, and weather patterns. Warmer air can hold more moisture, which explains why heavy rainfall events are becoming more intense in many regions. Warmer oceans provide more energy for tropical cyclones, potentially increasing their maximum wind speeds and rainfall. Changes in temperature gradients between the equator and poles can alter the position and strength of jet streams and pressure systems, which in turn affects storm tracks and regional weather patterns.
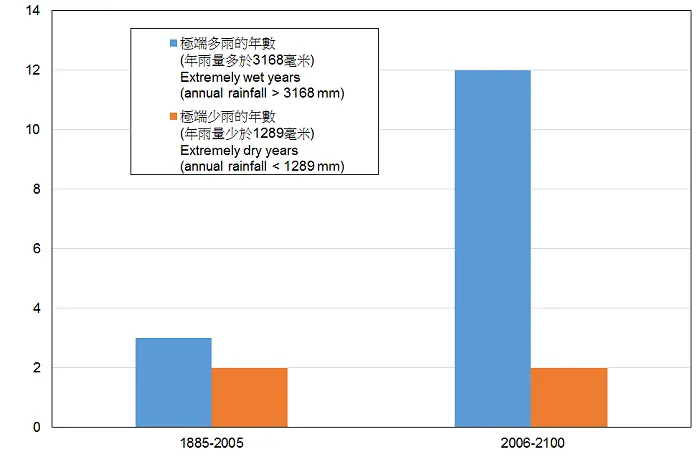
These global mechanisms explain the local changes observed in Hong Kong. Rising temperatures are consistent with the overall warming trend. More intense rainfall events, including the record-breaking August daily rainfall of 398.9 millimetres in 2025, are consistent with a warmer atmosphere carrying more moisture. The unprecedented number of tropical cyclone approaches in 2025, while anomalous, may reflect changes in the large-scale steering patterns influenced by a warming climate.
These global mechanisms explain the local changes observed in Hong Kong. Rising temperatures are consistent with the overall warming trend. More intense rainfall events, including the record-breaking August daily rainfall of 398.9 millimetres in 2025, are consistent with a warmer atmosphere carrying more moisture. The unprecedented number of tropical cyclone approaches in 2025, while anomalous, may reflect changes in the large-scale steering patterns influenced by a warming climate.
 https://berkeleyearth.org/global-temperature-report-for-2024/
|
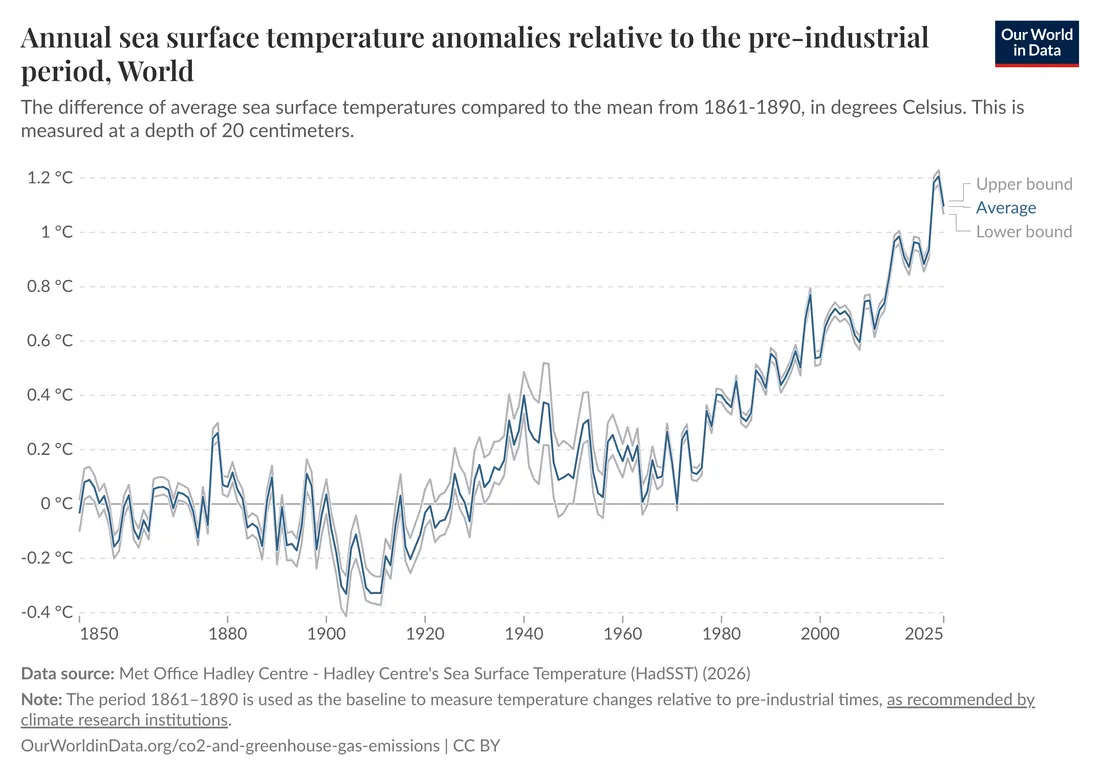 https://ourworldindata.org/grapher/sea-surface-temperature-anomaly
|
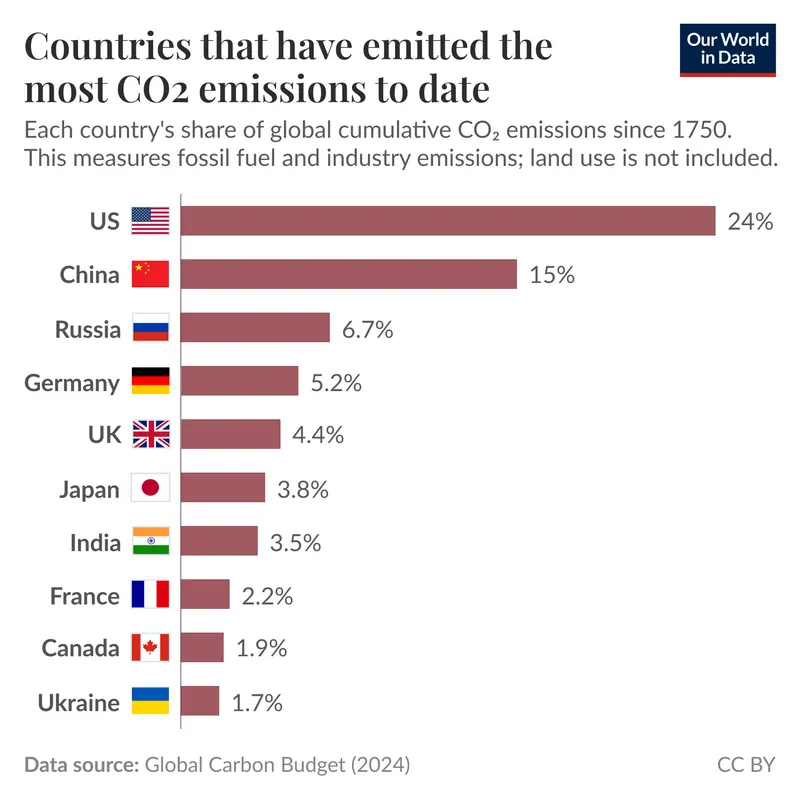 https://ourworldindata.org/data-insights/which-countries-have-contributed-the-most-to-historical-co-emissions
|
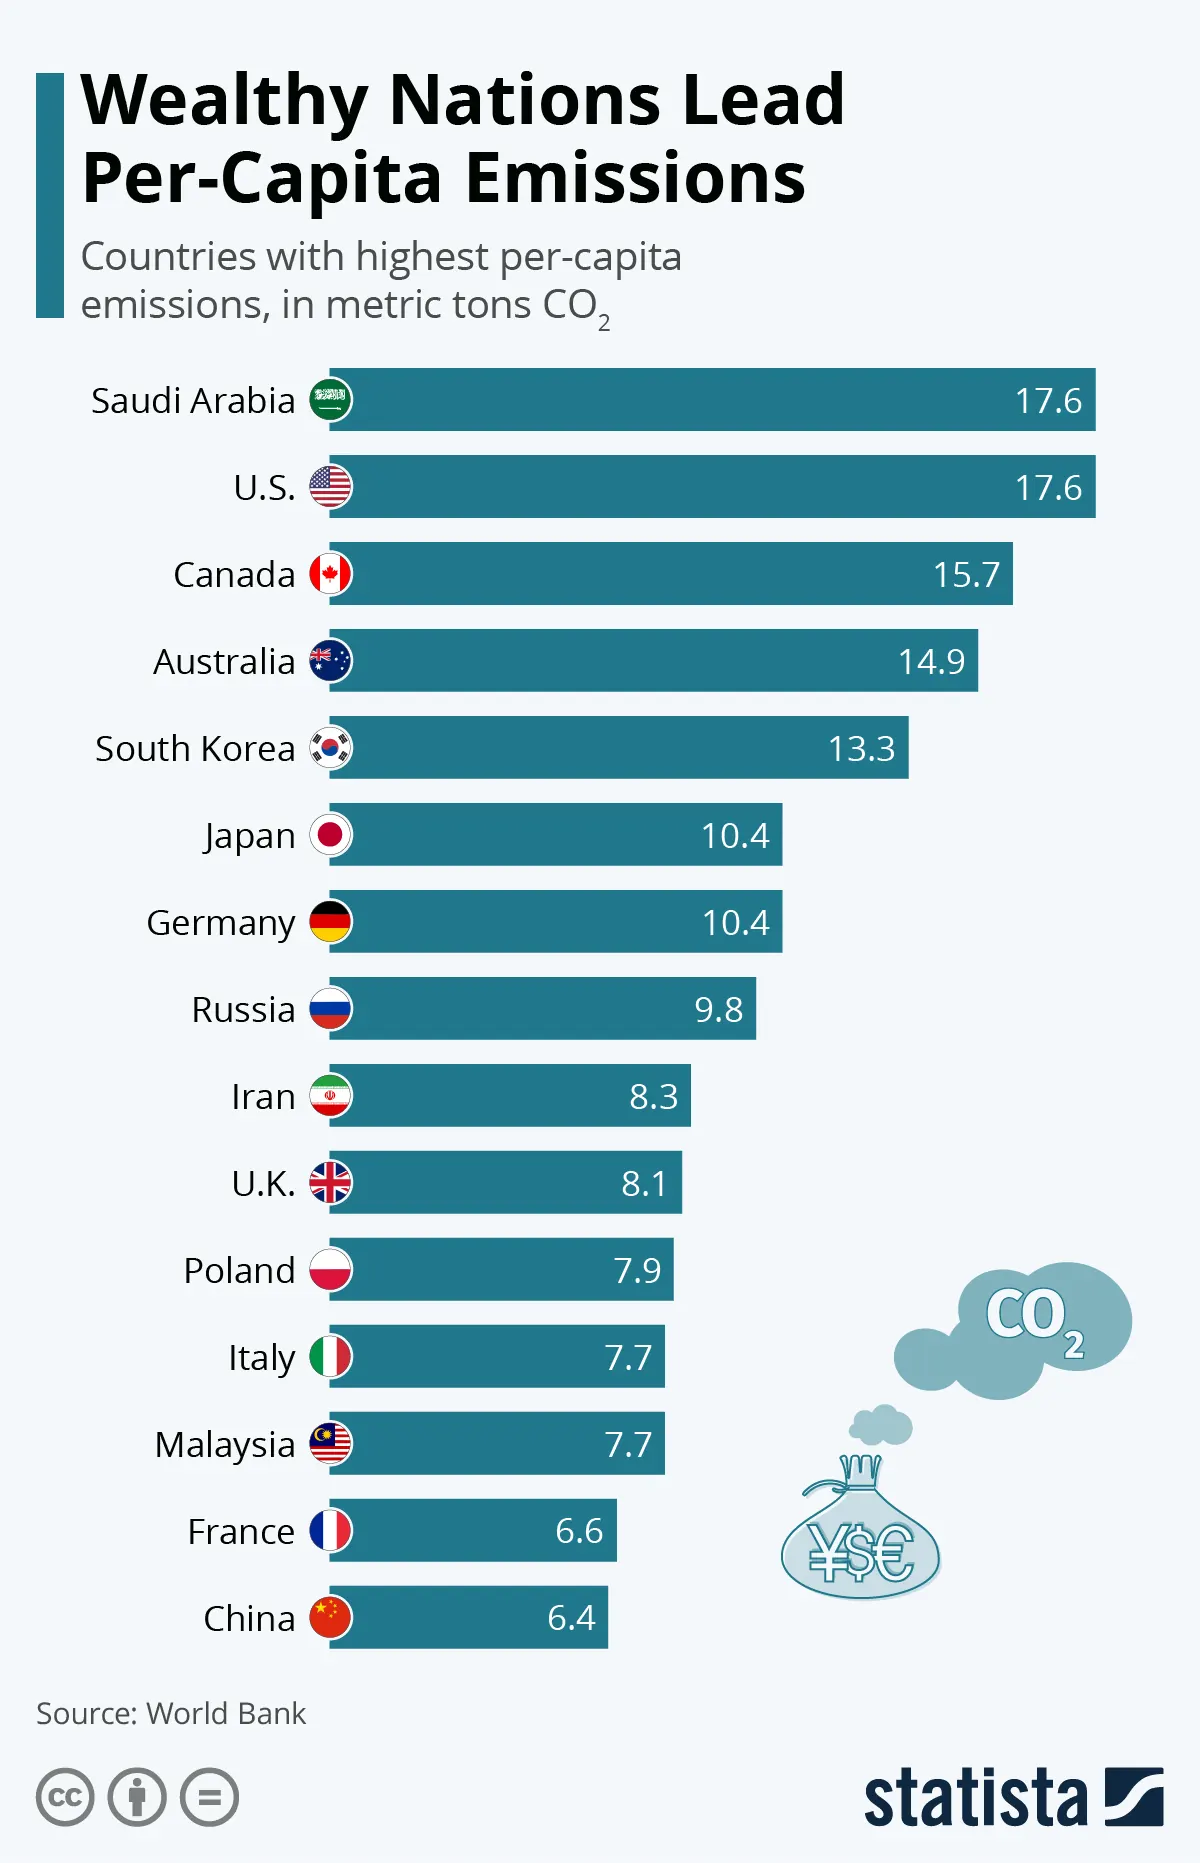 https://www.statista.com/chart/24306/carbon-emissions-per-capita-by-country/?srsltid=AfmBOoqNCcTRwcEdbbDmBJNbWGjtbmkgNE2bupyQgIVwuhYm20Z7Pw40
|
Responding to Climate Change
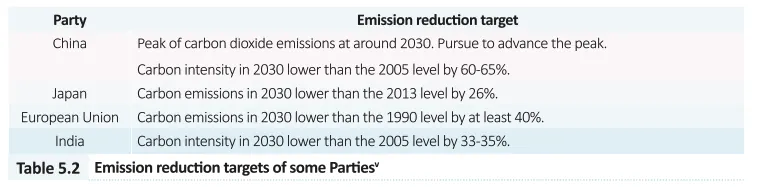
Addressing a global issue like climate change requires cooperation at many levels, from international agreements to actions taken by individuals. Two of the most significant international efforts to reduce greenhouse gas emissions are the Kyoto Protocol and the Paris Agreement.
The Kyoto Protocol (1997) was built on the principle of "common but differentiated responsibilities," placing a heavier emission reduction burden on wealthier countries. It used a "top-down" approach with specific targets for these nations. Its effectiveness was limited as some major countries did not participate, and rapidly developing countries were not required to have targets.
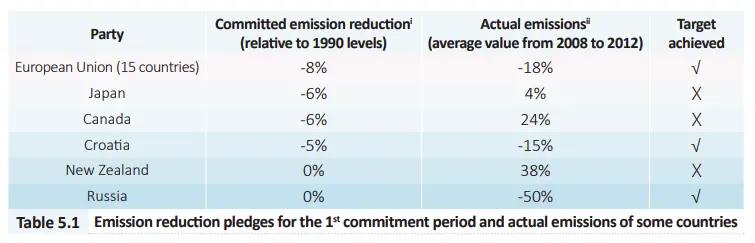
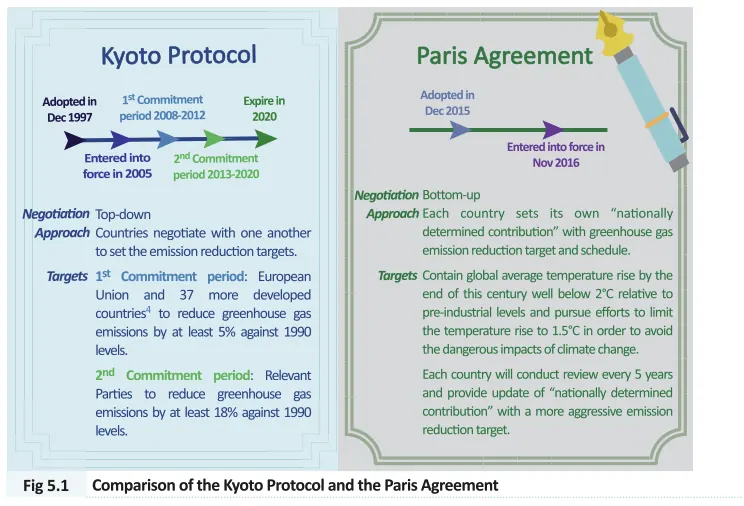
The Paris Agreement (2015) uses a different "bottom-up" structure. Its main goal is to limit global temperature rise to well below 2°C, aiming for 1.5°C. Each country determines its own "nationally determined contribution"—a plan with emission reduction targets based on its national circumstances. This approach allows for broader participation, with countries updating their plans every five years with more ambitious goals.
The IPCC Special Report on Global Warming of 1.5°C
In 2018, the Intergovernmental Panel on Climate Change (IPCC) published a special report at the request of policymakers. This report examined the impacts of limiting global warming to 1.5°C above pre-industrial levels, compared to a warming of 2°C. The report found that keeping warming to 1.5°C would have clear benefits. It would result in a slower rate of sea-level rise, reducing risks for coastal communities and small islands. It would also mean lower impacts on ecosystems on land and in the ocean, including reducing ocean acidification and risks to marine biodiversity. Furthermore, it would lower climate-related risks to human health, food security, and economic growth.
Human activities have already caused the Earth to warm by approximately 1°C. To limit further warming to 1.5°C, the report states that global carbon emissions from human activities would need to decline by about 40% from 2010 levels by 2030, and reach net-zero around 2050. Achieving this would require rapid and far-reaching changes in all aspects of society. The report also notes that the current emission reduction pledges made by countries under the Paris Agreement are not enough to meet the 1.5°C goal. Based on these pledges, a global warming of around 3°C by the end of this century is considered more likely.
In 2018, the Intergovernmental Panel on Climate Change (IPCC) published a special report at the request of policymakers. This report examined the impacts of limiting global warming to 1.5°C above pre-industrial levels, compared to a warming of 2°C. The report found that keeping warming to 1.5°C would have clear benefits. It would result in a slower rate of sea-level rise, reducing risks for coastal communities and small islands. It would also mean lower impacts on ecosystems on land and in the ocean, including reducing ocean acidification and risks to marine biodiversity. Furthermore, it would lower climate-related risks to human health, food security, and economic growth.
Human activities have already caused the Earth to warm by approximately 1°C. To limit further warming to 1.5°C, the report states that global carbon emissions from human activities would need to decline by about 40% from 2010 levels by 2030, and reach net-zero around 2050. Achieving this would require rapid and far-reaching changes in all aspects of society. The report also notes that the current emission reduction pledges made by countries under the Paris Agreement are not enough to meet the 1.5°C goal. Based on these pledges, a global warming of around 3°C by the end of this century is considered more likely.
Activity: Mapping the 2024 Climate Crisis
Objective: Use Geographic Heatmaps to identify patterns in global warming, industrial impact, and environmental recovery.
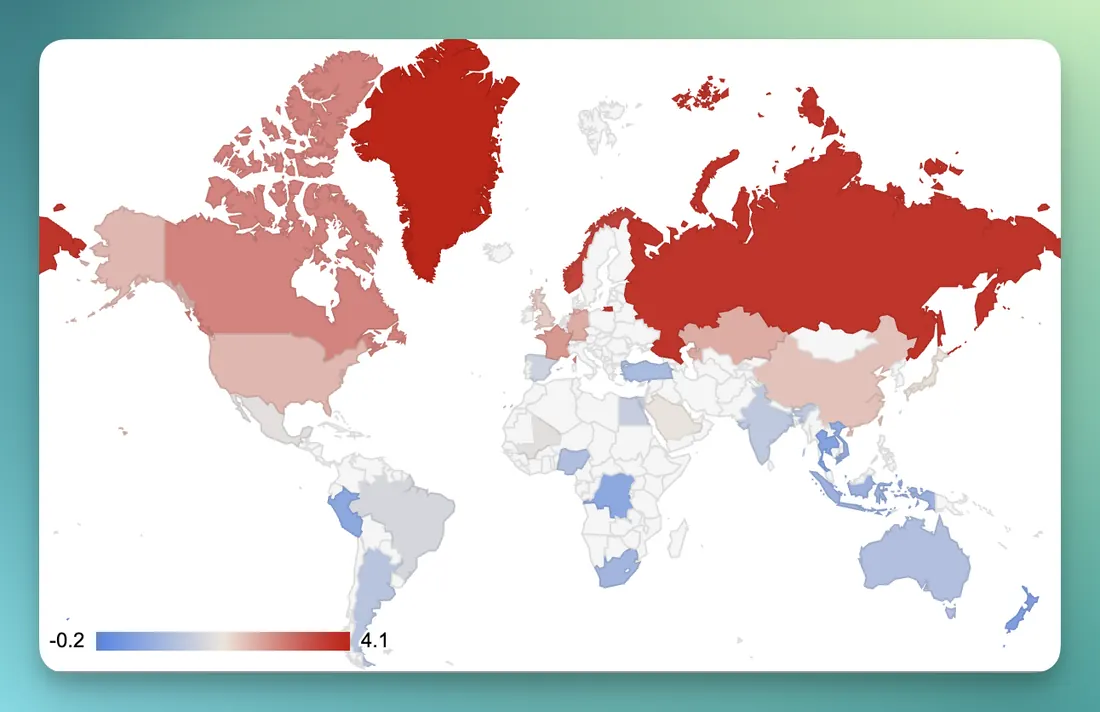
IntroductionIn this lab, we are analyzing data from 2024, officially the hottest year in recorded history. We will be comparing temperature "anomalies" against the historical baseline (1951–1980) to see which parts of our planet are changing the fastest.
IntroductionIn this lab, we are analyzing data from 2024, officially the hottest year in recorded history. We will be comparing temperature "anomalies" against the historical baseline (1951–1980) to see which parts of our planet are changing the fastest.
The 2024 Global Heatmap
Step 1: Access the Data
- Click the link provided by your teacher.
- Select "Make a copy" of your spreadsheet to access it.
Step 2: Build the Geographic Heatmap
- Highlight the necessary data from spreadsheet.
- Go to Insert > Chart.
- In the Chart Editor on the right:
- Chart Type: Scroll down and select Geo chart.
- Customize Tab > Geo: * Change Min color to Light Blue.
- Change Max color to Deep Red.